

In-Silico Integration Approach to Identify a Key miRNA Regulating a Gene Network in Aggressive Prostate Cancer
- PMID: 29562723
- PMCID: PMC5877771
- DOI: 10.3390/ijms19030910
In-Silico Integration Approach to Identify a Key miRNA Regulating a Gene Network in Aggressive Prostate Cancer
Abstract
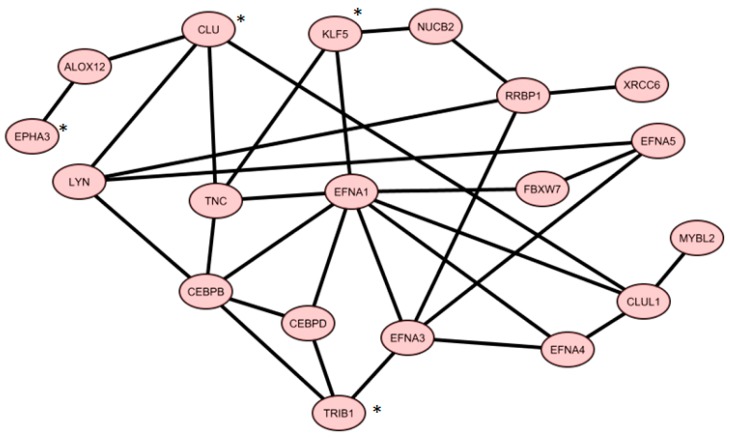
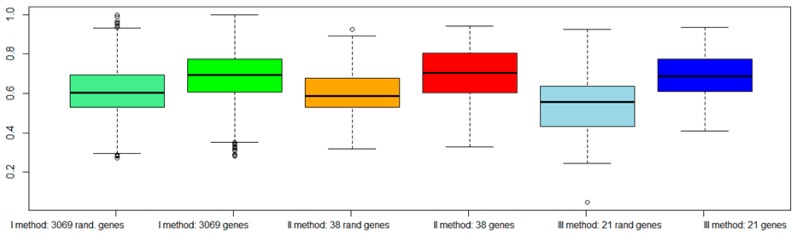
Like other cancer diseases, prostate cancer (PC) is caused by the accumulation of genetic alterations in the cells that drives malignant growth. These alterations are revealed by gene profiling and copy number alteration (CNA) analysis. Moreover, recent evidence suggests that also microRNAs have an important role in PC development. Despite efforts to profile PC, the alterations (gene, CNA, and miRNA) and biological processes that correlate with disease development and progression remain partially elusive. Many gene signatures proposed as diagnostic or prognostic tools in cancer poorly overlap. The identification of co-expressed genes, that are functionally related, can identify a core network of genes associated with PC with a better reproducibility. By combining different approaches, including the integration of mRNA expression profiles, CNAs, and miRNA expression levels, we identified a gene signature of four genes overlapping with other published gene signatures and able to distinguish, in silico, high Gleason-scored PC from normal human tissue, which was further enriched to 19 genes by gene co-expression analysis. From the analysis of miRNAs possibly regulating this network, we found that hsa-miR-153 was highly connected to the genes in the network. Our results identify a four-gene signature with diagnostic and prognostic value in PC and suggest an interesting gene network that could play a key regulatory role in PC development and progression. Furthermore, hsa-miR-153, controlling this network, could be a potential biomarker for theranostics in high Gleason-scored PC.
Keywords: co-expressed genes; copy number alterations; microRNA/miRNA; prostate cancer.
Conflict of interest statement
The authors declare no conflict of interest.
Figures


Similar articles
-
Screening the key microRNAs and transcription factors in prostate cancer based on microRNA functional synergistic relationships.Medicine (Baltimore). 2017 Jan;96(1):e5679. doi: 10.1097/MD.0000000000005679. Medicine (Baltimore). 2017. PMID: 28072703 Free PMC article.
-
Expression profile analysis reveals putative prostate cancer-related microRNAs.Genet Mol Res. 2013 Oct 24;12(4):4934-43. doi: 10.4238/2013.October.24.4. Genet Mol Res. 2013. PMID: 24301753
-
Identification of microRNA signature and potential pathway targets in prostate cancer.Exp Biol Med (Maywood). 2017 Mar;242(5):536-546. doi: 10.1177/1535370216681554. Epub 2016 Dec 8. Exp Biol Med (Maywood). 2017. PMID: 27903835 Free PMC article.
-
Role of miRNA-145, 148, and 185 and Stem Cells in Prostate Cancer.Int J Mol Sci. 2022 Jan 30;23(3):1626. doi: 10.3390/ijms23031626. Int J Mol Sci. 2022. PMID: 35163550 Free PMC article. Review.
-
Recent scenario of microRNA as diagnostic and prognostic biomarkers of prostate cancer.Urol Oncol. 2017 Mar;35(3):92-101. doi: 10.1016/j.urolonc.2016.10.019. Epub 2016 Nov 24. Urol Oncol. 2017. PMID: 27890424 Review.
Cited by
-
Exploration of the Tumor Mutational Burden as a Prognostic Biomarker and Related Hub Gene Identification in Prostate Cancer.Technol Cancer Res Treat. 2021 Jan-Dec;20:15330338211052154. doi: 10.1177/15330338211052154. Technol Cancer Res Treat. 2021. PMID: 34806485 Free PMC article.
-
Computational Approaches in Theranostics: Mining and Predicting Cancer Data.Pharmaceutics. 2019 Mar 13;11(3):119. doi: 10.3390/pharmaceutics11030119. Pharmaceutics. 2019. PMID: 30871264 Free PMC article. Review.
-
Castration-resistant prostate cancer monitoring by cell-free circulating biomarkers.Front Oncol. 2024 Sep 10;14:1394292. doi: 10.3389/fonc.2024.1394292. eCollection 2024. Front Oncol. 2024. PMID: 39319053 Free PMC article. Review.
-
Discovering Gene Signature Shared by Prostate Cancer and Neurodegenerative Diseases Based on the Bioinformatics Approach.Comput Math Methods Med. 2022 Jun 28;2022:8430485. doi: 10.1155/2022/8430485. eCollection 2022. Comput Math Methods Med. 2022. Retraction in: Comput Math Methods Med. 2023 Dec 6;2023:9787232. doi: 10.1155/2023/9787232. PMID: 35799671 Free PMC article. Retracted.
-
Secreted miR-153 Controls Proliferation and Invasion of Higher Gleason Score Prostate Cancer.Int J Mol Sci. 2022 Jun 6;23(11):6339. doi: 10.3390/ijms23116339. Int J Mol Sci. 2022. PMID: 35683018 Free PMC article.
References
-
- McDonald A.C., Vira M.A., Vidal A.C., Gan W., Freedland S.J., Taioli E. Association between systemic inflammatory markers and serum prostate-specific antigen in men without prostatic disease—The 2001–2008 National Health and Nutrition Examination Survey. Prostate. 2014;74:561–567. doi: 10.1002/pros.22782. - DOI - PMC - PubMed
MeSH terms
Substances
LinkOut - more resources
Full Text Sources
Other Literature Sources
Medical
