. 2018 Jan 1:17:1533033818764470.
doi: 10.1177/1533033818764470.

High-Dose Deferoxamine Treatment Disrupts Intracellular Iron Homeostasis, Reduces Growth, and Induces Apoptosis in Metastatic and Nonmetastatic Breast Cancer Cell Lines

Affiliations

High-Dose Deferoxamine Treatment Disrupts Intracellular Iron Homeostasis, Reduces Growth, and Induces Apoptosis in Metastatic and Nonmetastatic Breast Cancer Cell Lines

Khuloud Bajbouj et al. Technol Cancer Res Treat. .

Abstract

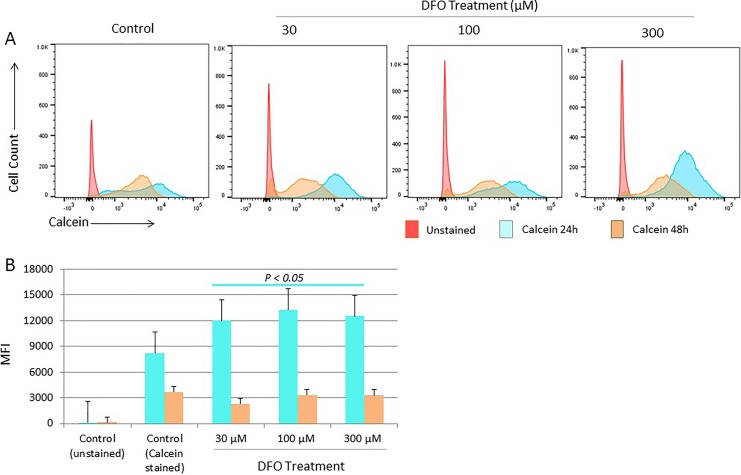
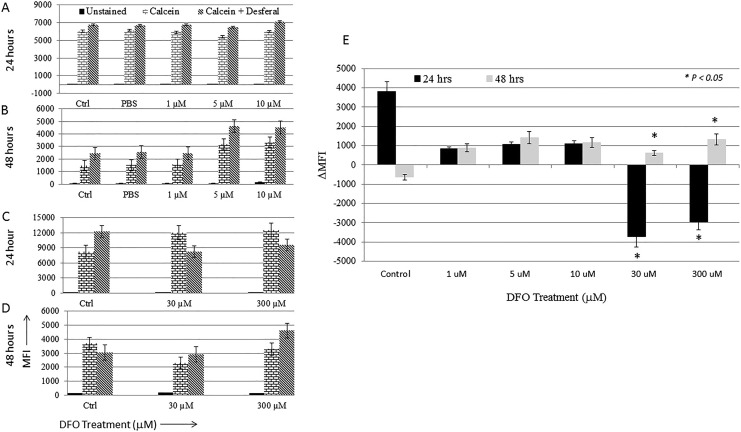
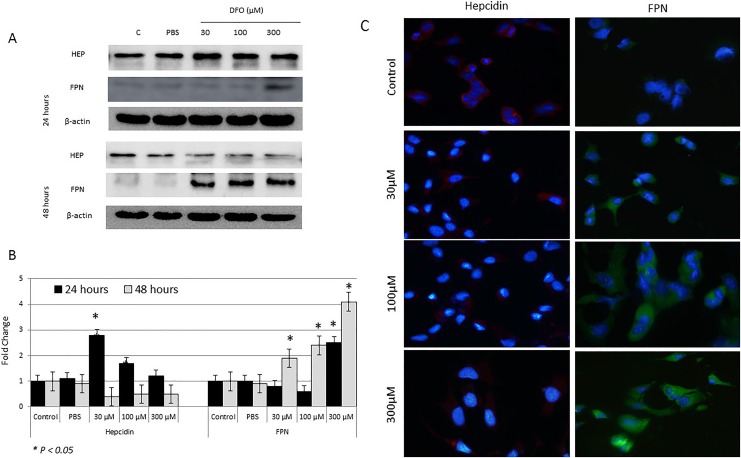
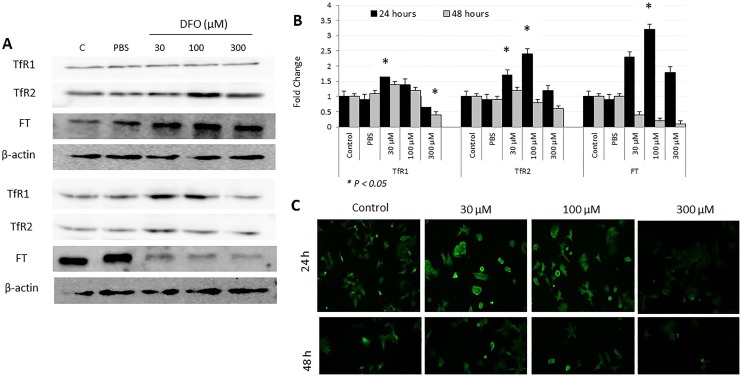
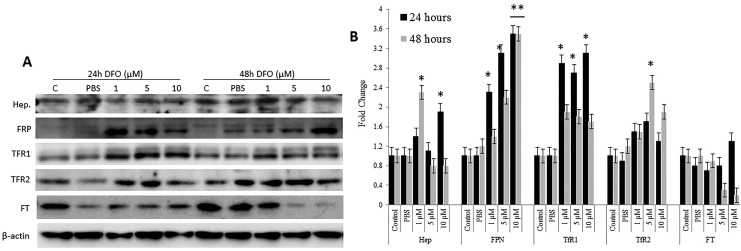
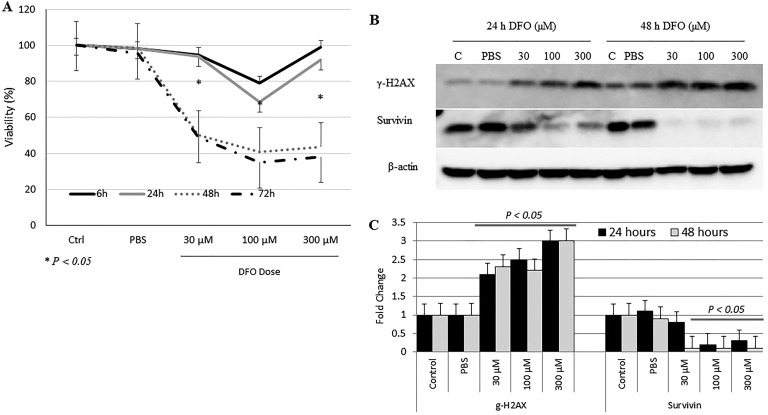
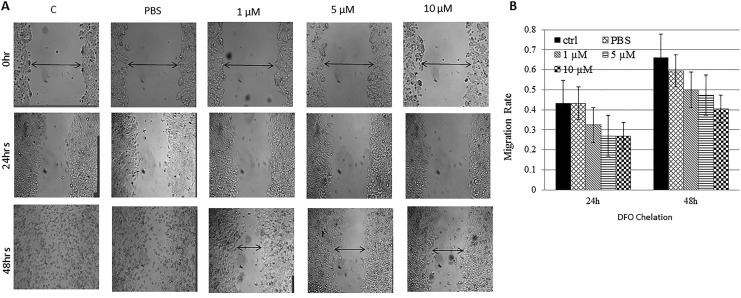
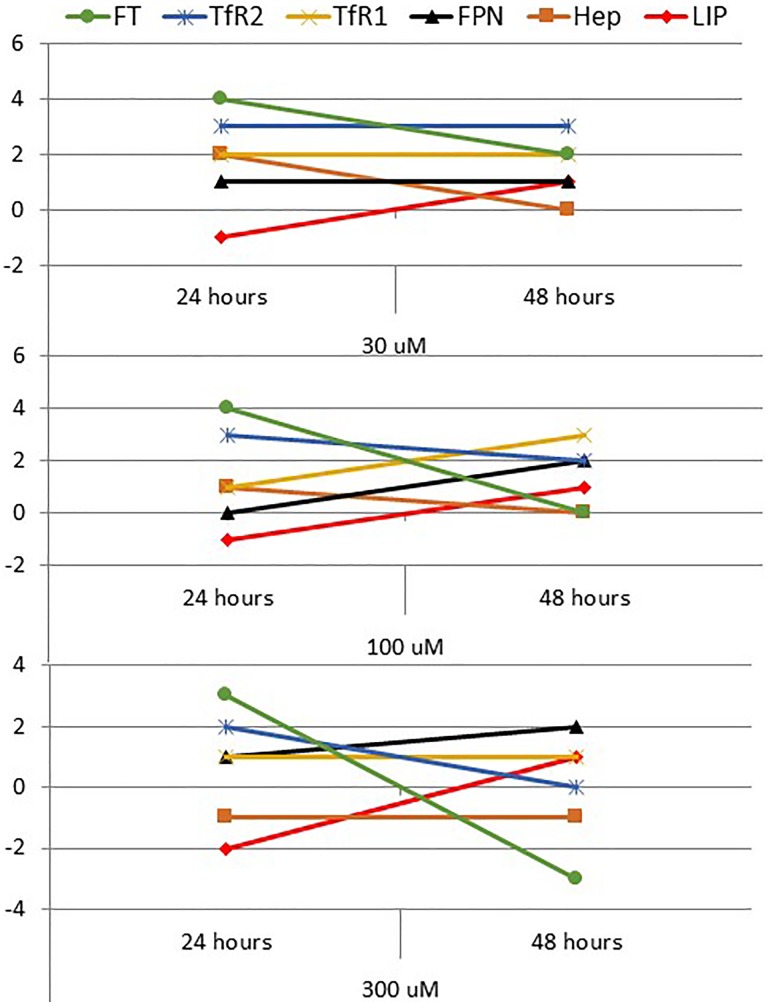
Mounting evidence suggest that iron overload enhances cancer growth and metastasis; hence, iron chelation is being increasingly used as part of the treatment regimen in patients with cancer. Now whether iron chelation depletes intracellular iron and/or disrupts intracellular iron homeostasis is yet to be fully addressed. MCF-7 and MDA-MB-231 breast cancer cells treated with increasing concentrations of the iron chelator deferoxamine were assessed for intracellular iron status, the expression of key proteins involved in iron metabolism, cell viability, growth potential, and apoptosis at different time points following treatment. Treatment with deferoxamine at 1, 5, or 10 μM for 24 or 48 hours, while not leading to significant changes in intracellular labile iron content, upregulated the expression of hepcidin, ferroportin, and transferrin receptors 1 and 2. In contrast, deferoxamine at 30, 100, or 300 μM for 24 hours induced a significant decrease in intracellular labile iron, which was associated with increased expression of hepcidin, ferritin, and transferrin receptors 1 and 2. At 48 hours, there was an increase in intracellular labile iron, which was associated with a significant reduction in hepcidin and ferritin expression and a significant increase in ferroportin expression. Although low-dose deferoxamine treatment resulted in a low to moderate decrease in MCF-7 cell growth, high-dose treatment resulted in a significant and precipitous decrease in cell viability and growth, which was associated with increased expression of phosphorylated Histone 2A family member X and near absence of survivin. High-dose deferoxamine treatment also resulted in a very pronounced reduction in wound healing and growth in MDA-MB-231 cells. These findings suggest that high-dose deferoxamine treatment disrupts intracellular iron homeostasis, reduces cell viability and growth, and enhances apoptosis in breast cancer cells. This is further evidence to the potential utility of iron chelation as an adjunctive therapy in iron-overloaded cancers.

Keywords: MCF-7; apoptosis; deferoxamine; ferritin; ferroportin; hepcidin; iron chelation.


Conflict of interest statement

Declaration of Conflicting Interests: The author(s) declared no potential conflicts of interest with respect to the research, authorship, and/or publication of this article.

Figures

Figure 1.
Figure 1.
Changes in labile iron pool (LIP) status in MCF-7 cells following deferoxamine (DFO) treatment. Intracellular iron content was assessed in cells treated with increasing concentrations of DFO versus untreated cells at 24 and 48 hours by flow cytometry calcein acetoxymethyl ester (CA-AM)-based method. A, Representative sample of flow cytometry histogram overlays of CA-AM staining in control cells as well as cells treated with DFO at 30, 100, or 300 µM for 24 hours and 48 hours. B, Calculated averages ± standard error of the mean (SEM) of mean fluorescence intensity (MFI) using histograms as in (A) of 3 separate experiments. P > .05 signifies the presence of a statistically significant difference in MFI (B) between control and treated groups at 24 hours.
Figure 2.
Figure 2.
Labile iron pool (LIP) status in MCF-7 cells following treatment with increasing concentrations of deferoxamine (DFO). The effect of iron chelation dose on intracellular iron content was assessed in untreated cells and cells treated with DFO by comparing calcein acetoxymethyl ester (CA-AM)-stained cells with that of CA-AM + chelator-stained cells as explained in Methods section. Average mean fluorescence intensity (MFI) ± standard error of the mean (SEM) of histograms obtained from 2 separate experiments for cells treated with 1, 5, or 10 μM DFO for 24 hours (A) and 48 hours (B) and from 3 separate experiments for cells treated with 30, 100, or 300 μM DFO for 24 hours (C) and 48 hours (D). E, Average change MFI (▵MFI) ± SEM in control and treated cells at 24 and 48 hours as calculated by the formula given in Methods section. P > .05 signifies the presence of a statistically significant difference in ▵MFI (E) in the specific control or experimental group.
Figure 3.
Figure 3.
Assessment of cytoplasmic hepcidin and ferroportin (FPN) protein levels in control and deferoxamine (DFO)-treated MCF-7 cells. A, Lysates of cells treated with 30, 100, or 300 µM DFO and those of controls were assessed for hepcidin and FPN by Western blotting at 24 and 48 hours posttreatment. B, Calculated fold change in protein expression levels in treated and controls cells based on 3 separate experiments ± SEM. C, Assessment of cytoplasmic hepcidin and FPN expression by immunofluorescence in control and treated cells at 48 hours; a sample urn of 3 separate experiments. B, The presence of a statistically significant difference (P > .05) in protein expression levels between treated cells and untreated controls at the specific time point is denoted by *.
Figure 4.
Figure 4.
Expression patterns of transferrin receptor 1 (TfR1), TfR2, and ferroportin (FT) proteins in deferoxamine (DFO)-treated and control MCF-7 cells. A, Total cell lysates from MCF-7 cells treated with increasing concentrations of DFO (30, 100, or 300 µm) or left untreated were used to assess for TFR1, TfR2, and FT at 24 and 48 hours posttreatment. B, Average fold change ± standard error of the mean in the level of expression of TfR1, TfR2, and FT based on 3 separate experiments. C, Assessment of cell surface expression of TFR1 by immunofluorescence in controls and DFO-treated cells at 24 and 48 hours; data shown are representative of 3 separate experiments. B, The presence of a statistically significant difference (P >. 05) in protein expression levels between treated cells and untreated controls at the specific time point is denoted by *.
Figure 5.
Figure 5.
Expression pattern of iron homeostasis proteins in MCF-7 cells following low-dose deferoxamine (DFO) treatment. A, Total cell lysates from MCF-7 cells treated with 1, 5, or 10 µm DFO or left untreated were assessed for the expression of Hep, ferroportin (FPN), transferrin receptor 1 (TFR1), TfR2, and ferritin (FT) at 24 and 48 hours posttreatment. B, Average fold change ± standard error of the mean in the level of expression of the same proteins as in A. *A statistically significant change (P > .05) in protein expression levels between treated and untreated cells at the indicated time point.
Figure 6.
Figure 6.
Evaluation of cell viability and apoptotic potential following deferoxamine (DFO) treatment. A, The viability of cells treated with increasing concentrations of DFO (30, 100, or 300 µm) was evaluated at 6, 24, 48 and 72 hours posttreatment using the 3-(4,5-dimethylthiazol-2-yl)-2,5-diphenyltetrazolium bromide (MTT) assay. B, Levels of expression of γ-H2AX and survivin were assessed by Western blotting in untreated cells and in cells treated with DFO (30, 100, or 300 µm) at 24 and 48 hours after treatment. C, Average fold change ± SEM in the level of expression of γ-H2AX and survivin based on 3 separate experiments; data shown are representative of 2 separate experiments. A, *signifies the presence of statistically significant differences (P > 0.05) in cell viability within the same control or experimental group at 24 versus 48 hours (A); statistically significant differences (P > .05) in fold change of protein expression between treated cells and untreated controls is also indicated (C).
Figure 7.
Figure 7.
Wound healing potential of DFO-treated versus untreated cells: Disrupted MCF-7 treated with low- (A) and high-dose DFO (C) as well as MDA-MB-213 (E) cell cultures were photographed at 0, 6, 24, and 48 hours; and healing was qualitatively assessed by observing wound closure, migration of viable cells to wound area, and dead cells floating; data shown are representative of 2 separate experiments. Migration rates of viable cells into wound area in both untreated and DFO-treated disrupted MCF-7 (B, D) and MDAMB-231 (F) cell cultures were measured at 6, 24, and 48 hours using the formula: Migration rate = (mean width at 0 hours – mean width at time point (6, 12 or 24 hours)/mean width at 0 hours. *The presence of a statistically significant difference (P > 0.05) in rate of migration between treated cells and controls at the specified concentration/time point.
Figure 8.
Figure 8.
Summary figure of the trend of change in labile iron pool (LIP) and iron regulatory proteins in treated cells when compared with untreated controls at 24 and 48 hours. A change in any parameter was arbitrarily defined as 0 (no change), 1 (minor), 2 (intermediate), or 3 (major) in the up (+) or down (−) direction.

References

    1. Anderson GJ, Wang F. Essential but toxic: controlling the flux of iron in the body. Clin Exp Pharmacol Physiol. 2012;39(8):719–724. - PubMed
    1. Nemeth E, Tuttle MS, Powelson J, et al. Hepcidin regulates cellular iron efflux by binding to ferroportin and inducing its internalization. Science. 2004;306(5704):2090–2093. - PubMed
    1. Peyssonnaux C, Zinkernagel AS, Schuepbach RA, et al. Regulation of iron homeostasis by the hypoxia-inducible transcription factors (HIFs). J Clin Invest. 2007;117(7):1926–1932. - PMC - PubMed
    1. Tanno T, Bhanu NV, Oneal PA, et al. High levels of GDF15 in thalassemia suppress expression of the iron regulatory protein hepcidin. Nat Med. 2007;3(9):1096–1101. - PubMed
    1. Silvestri L, Pagani A, Nai A, De Domenico I, Kaplan J, Camaschella C. The serine protease matriptase-2 (TMPRSS6) inhibits hepcidin activation by cleaving membrane hemojuvelin. Cell Metab. 2008;8(6):502–511. - PMC - PubMed

Publication types