

Integration of induced pluripotent stem cell-derived endothelial cells with polycaprolactone/gelatin-based electrospun scaffolds for enhanced therapeutic angiogenesis
- PMID: 29562916
- PMCID: PMC5863387
- DOI: 10.1186/s13287-018-0824-2
Integration of induced pluripotent stem cell-derived endothelial cells with polycaprolactone/gelatin-based electrospun scaffolds for enhanced therapeutic angiogenesis
Abstract
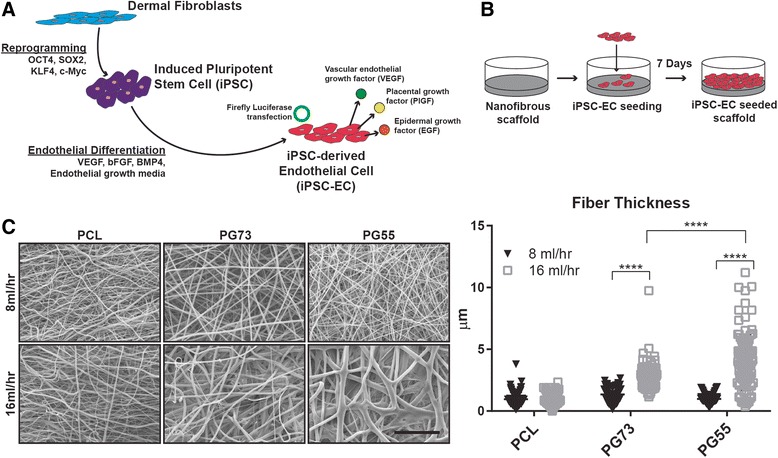
Background: Induced pluripotent stem-cell derived endothelial cells (iPSC-ECs) can be generated from any somatic cell and their iPSC sources possess unlimited self-renewal. Previous demonstration of their proangiogenic activity makes them a promising cell type for treatment of ischemic injury. As with many other stem cell approaches, the low rate of in-vivo survival has been a major limitation to the efficacy of iPSC-ECs to date. In this study, we aimed to increase the in-vivo lifetime of iPSC-ECs by culturing them on electrospun polycaprolactone (PCL)/gelatin scaffolds, before quantifying the subsequent impact on their proangiogenic function.
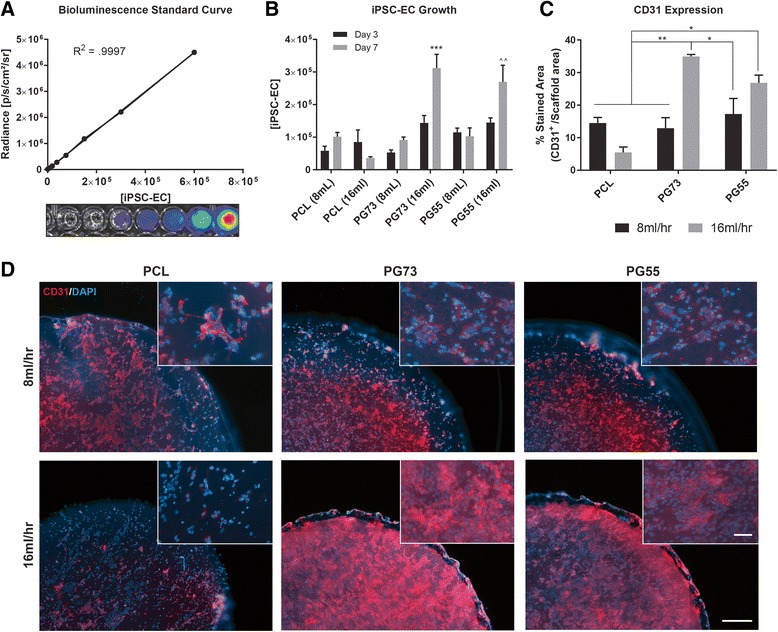
Methods: iPSC-ECs were isolated and stably transfected with a luciferase reporter to facilitate quantification of cell numbers and non-invasive imaging in-vivo PCL/gelatin scaffolds were engineered using electrospinning to obtain woven meshes of nanofibers. iPSC-ECs were cultured on scaffolds for 7 days. Subsequently, cell growth and function were assessed in vitro followed by implantation in a mouseback subcutaneous model for 7 days.
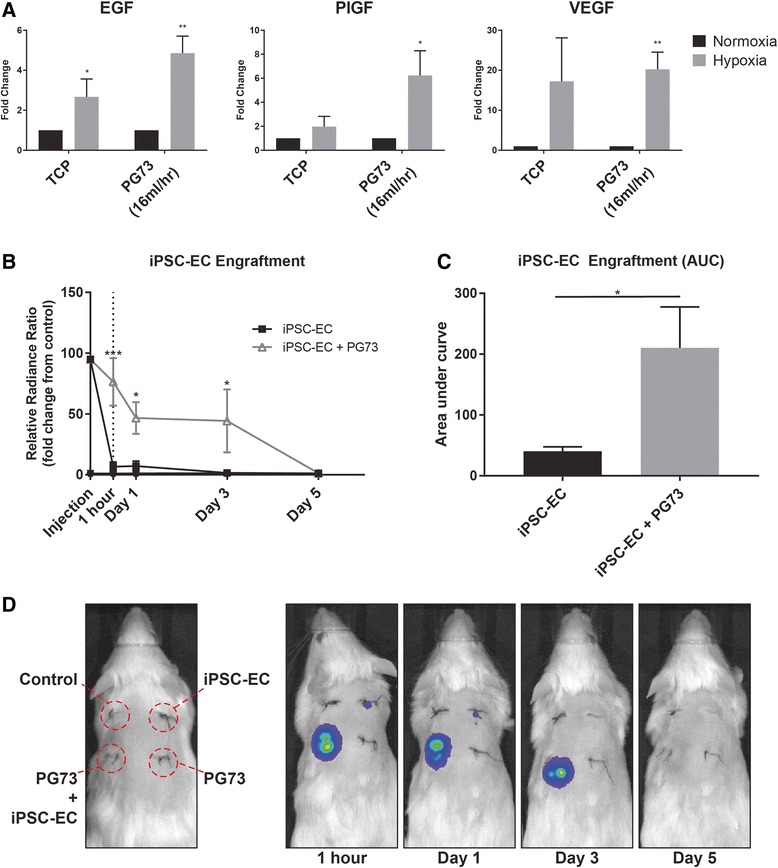
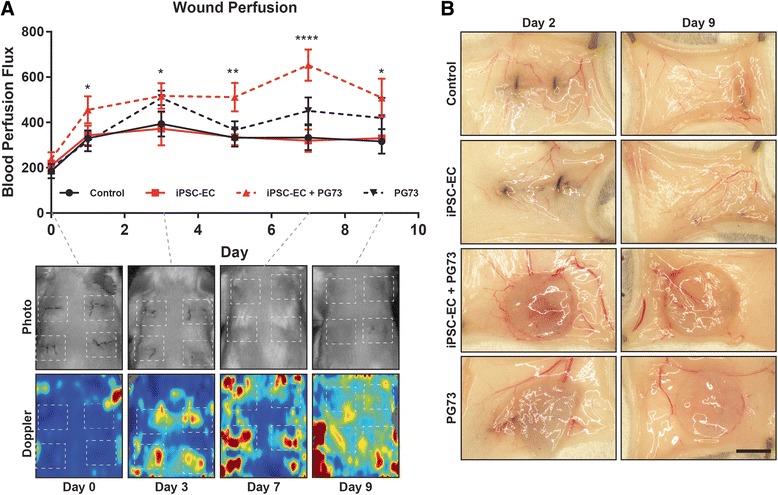
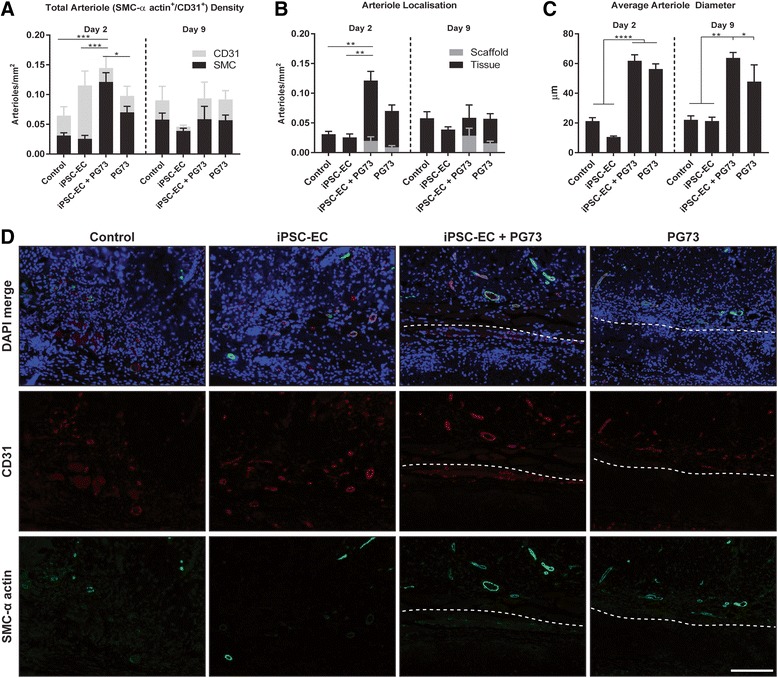
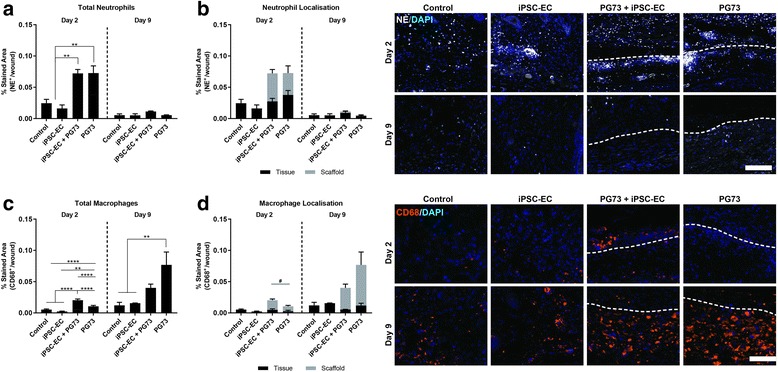
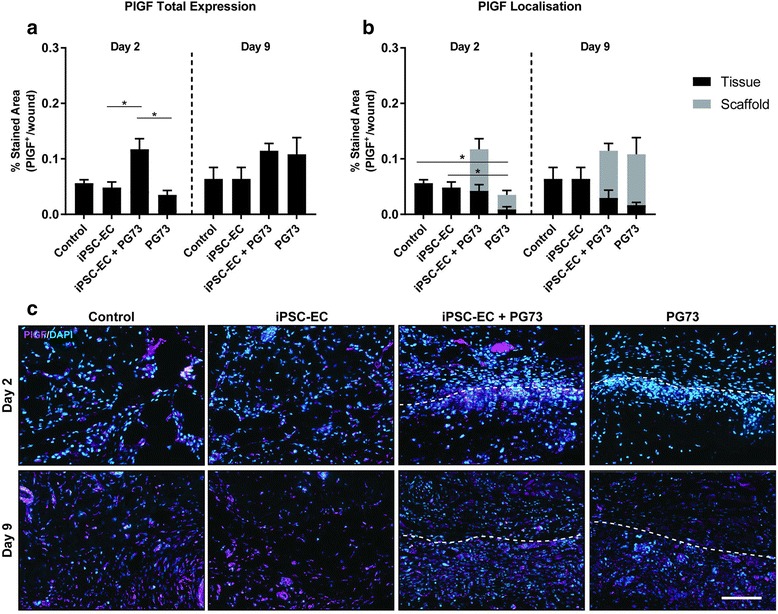
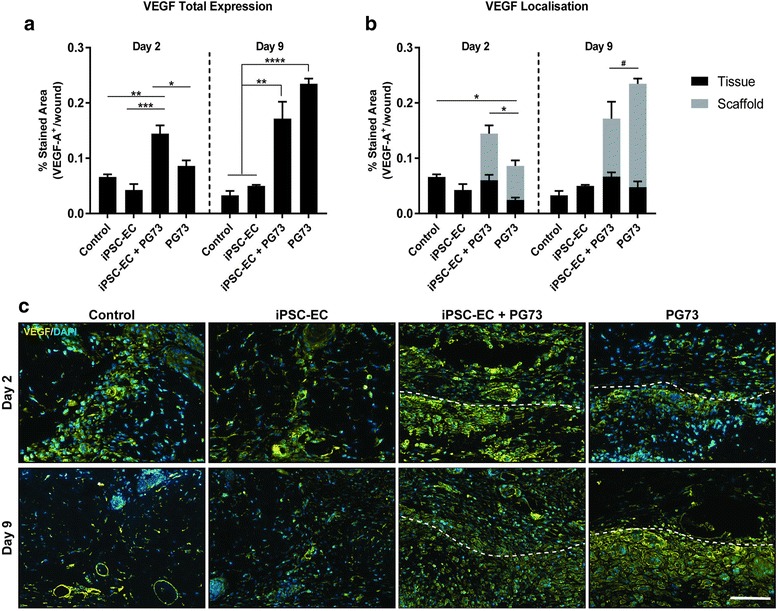
Results: Using a matrix of conditions, we found that scaffold blends with ratios of PCL:gelatin of 70:30 (PG73) spun at high flow rates supported the greatest levels of iPSC-EC growth, retention of phenotype, and function in vitro. Implanting iPSC-ECs seeded on PG73 scaffolds in vivo improved their survival up to 3 days, compared to cells directly injected into control wounds, which were no longer observable within 1 h. Enhanced engraftment improved blood perfusion, observed through non-invasive laser Doppler imaging. Immunohistochemistry revealed a corresponding increase in host angiogenic mechanisms characterized by the enhanced recruitment of macrophages and the elevated expression of proangiogenic cytokines vascular endothelial growth factor and placental growth factor.
Conclusions: Knowledge of these mechanisms combined with a deeper understanding of the scaffold parameters influencing this function provides the groundwork for optimizing future iPSC-EC therapies utilizing engraftment platforms. The development of combined scaffold and iPSC-EC therapies could ultimately improve therapeutic angiogenesis and the treatment of ischemic injury.
Keywords: Angiogenesis; Biomaterial scaffolds; Endothelial cells; Induced pluripotent stem cells; Regenerative medicine.
Conflict of interest statement
Ethics approval and consent to participate
Study approval was obtained from Sydney Local Heath District Animal Welfare Committee (protocol number 2013/050). Experiments were conducted in accordance with the Australian Code of Practice for the Care and Use of Animals for Scientific Purpose.
Consent for publication
Not applicable.
Competing interests
The authors declare that they have no competing interests.
Publisher’s Note
Springer Nature remains neutral with regard to jurisdictional claims in published maps and institutional affiliations.
Figures
Similar articles
-
Combinatorial extracellular matrix microenvironments promote survival and phenotype of human induced pluripotent stem cell-derived endothelial cells in hypoxia.Acta Biomater. 2016 Oct 15;44:188-99. doi: 10.1016/j.actbio.2016.08.003. Epub 2016 Aug 4. Acta Biomater. 2016. PMID: 27498178 Free PMC article.
-
Aligned-Braided Nanofibrillar Scaffold with Endothelial Cells Enhances Arteriogenesis.ACS Nano. 2015 Jul 28;9(7):6900-8. doi: 10.1021/acsnano.5b00545. Epub 2015 Jun 17. ACS Nano. 2015. PMID: 26061869 Free PMC article.
-
Induced pluripotent stem cell-derived endothelial cells promote angiogenesis and accelerate wound closure in a murine excisional wound healing model.Biosci Rep. 2018 Jul 31;38(4):BSR20180563. doi: 10.1042/BSR20180563. Print 2018 Aug 31. Biosci Rep. 2018. PMID: 29976773 Free PMC article.
-
Regulation of endothelial cell differentiation in embryonic vascular development and its therapeutic potential in cardiovascular diseases.Life Sci. 2021 Jul 1;276:119406. doi: 10.1016/j.lfs.2021.119406. Epub 2021 Mar 27. Life Sci. 2021. PMID: 33785330 Review.
-
Endothelial Progenitor Cells for the Vascularization of Engineered Tissues.Tissue Eng Part B Rev. 2018 Feb;24(1):1-24. doi: 10.1089/ten.TEB.2017.0127. Epub 2017 Jul 3. Tissue Eng Part B Rev. 2018. PMID: 28548628 Free PMC article. Review.
Cited by
-
Advances for the treatment of lower extremity arterial disease associated with diabetes mellitus.Front Mol Biosci. 2022 Aug 17;9:929718. doi: 10.3389/fmolb.2022.929718. eCollection 2022. Front Mol Biosci. 2022. PMID: 36060247 Free PMC article. Review.
-
Environmental Specification of Pluripotent Stem Cell Derived Endothelial Cells Toward Arterial and Venous Subtypes.Front Bioeng Biotechnol. 2019 Jun 14;7:143. doi: 10.3389/fbioe.2019.00143. eCollection 2019. Front Bioeng Biotechnol. 2019. PMID: 31259171 Free PMC article. Review.
-
Induced pluripotent stem cell-derived smooth muscle cells increase angiogenesis and accelerate diabetic wound healing.Regen Med. 2020 Feb;15(2):1277-1293. doi: 10.2217/rme-2019-0086. Epub 2020 Mar 31. Regen Med. 2020. PMID: 32228292 Free PMC article.
-
Gelatin-containing porous polycaprolactone PolyHIPEs as substrates for 3D breast cancer cell culture and vascular infiltration.Front Bioeng Biotechnol. 2024 Jan 8;11:1321197. doi: 10.3389/fbioe.2023.1321197. eCollection 2023. Front Bioeng Biotechnol. 2024. PMID: 38260750 Free PMC article.
-
Bioceramic akermanite enhanced vascularization and osteogenic differentiation of human induced pluripotent stem cells in 3D scaffolds in vitro and vivo.RSC Adv. 2019 Aug 14;9(44):25462-25470. doi: 10.1039/c9ra02026h. eCollection 2019 Aug 13. RSC Adv. 2019. PMID: 35530104 Free PMC article.
References
Publication types
MeSH terms
Substances
Grants and funding
LinkOut - more resources
Full Text Sources
Other Literature Sources
Research Materials
