. 2018 Mar 21;6(1):53.
doi: 10.1186/s40168-018-0432-5.

Trees, fungi and bacteria: tripartite metatranscriptomics of a root microbiome responding to soil contamination

Affiliations

Trees, fungi and bacteria: tripartite metatranscriptomics of a root microbiome responding to soil contamination

E Gonzalez et al. Microbiome. .

Abstract

Background: One method for rejuvenating land polluted with anthropogenic contaminants is through phytoremediation, the reclamation of land through the cultivation of specific crops. The capacity for phytoremediation crops, such as Salix spp., to tolerate and even flourish in contaminated soils relies on a highly complex and predominantly cryptic interacting community of microbial life.

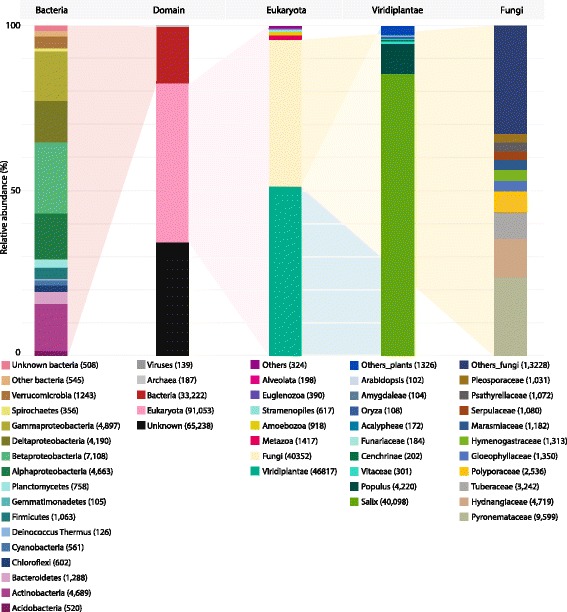
Methods: Here, Illumina HiSeq 2500 sequencing and de novo transcriptome assembly were used to observe gene expression in washed Salix purpurea cv. 'Fish Creek' roots from trees pot grown in petroleum hydrocarbon-contaminated or non-contaminated soil. All 189,849 assembled contigs were annotated without a priori assumption as to sequence origin and differential expression was assessed.

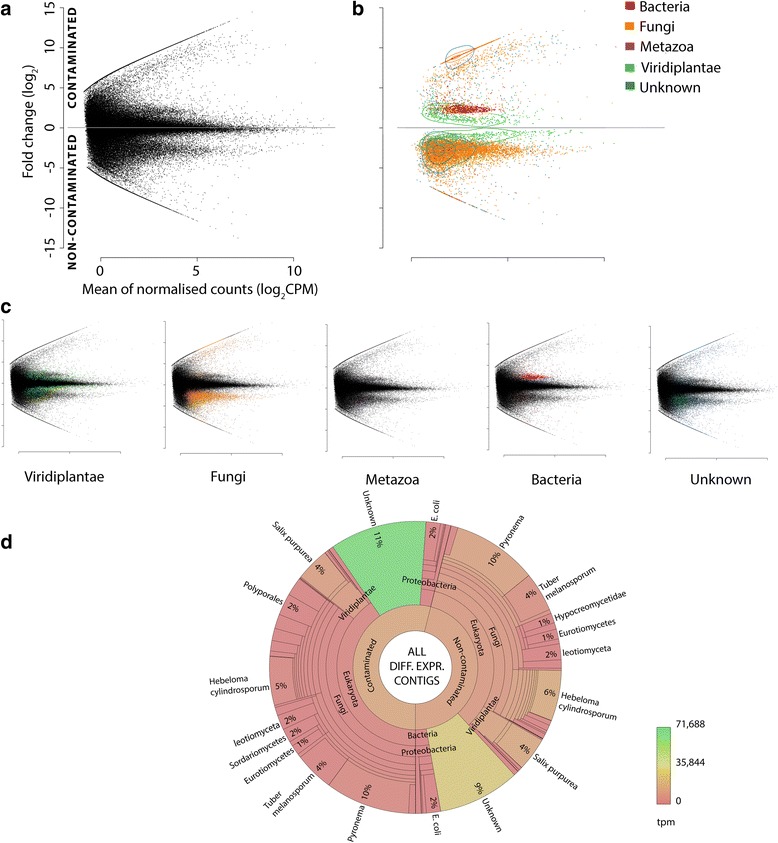
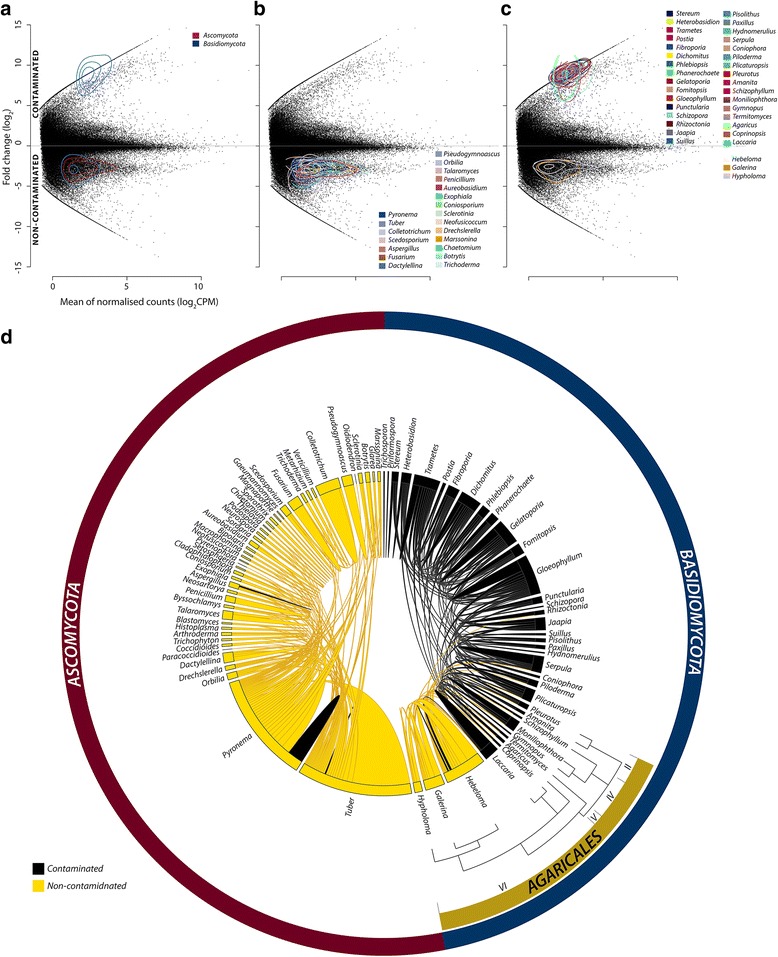
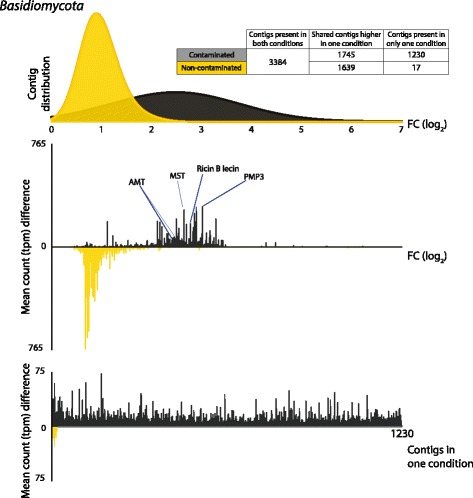
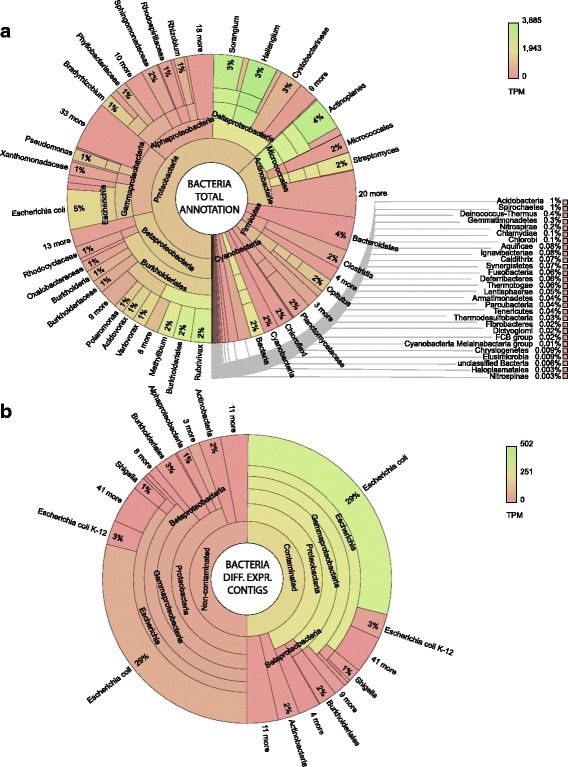
Results: The 839 contigs differentially expressed (DE) and annotated from S. purpurea revealed substantial increases in transcripts encoding abiotic stress response equipment, such as glutathione S-transferases, in roots of contaminated trees as well as the hallmarks of fungal interaction, such as SWEET2 (Sugars Will Eventually Be Exported Transporter). A total of 8252 DE transcripts were fungal in origin, with contamination conditions resulting in a community shift from Ascomycota to Basidiomycota genera. In response to contamination, 1745 Basidiomycota transcripts increased in abundance (the majority uniquely expressed in contaminated soil) including major monosaccharide transporter MST1, primary cell wall and lamella CAZy enzymes, and an ectomycorrhiza-upregulated exo-β-1,3-glucanase (GH5). Additionally, 639 DE polycistronic transcripts from an uncharacterised Enterobacteriaceae species were uniformly in higher abundance in contamination conditions and comprised a wide spectrum of genes cryptic under laboratory conditions but considered putatively involved in eukaryotic interaction, biofilm formation and dioxygenase hydrocarbon degradation.

Conclusions: Fungal gene expression, representing the majority of contigs assembled, suggests out-competition of white rot Ascomycota genera (dominated by Pyronema), a sometimes ectomycorrhizal (ECM) Ascomycota (Tuber) and ECM Basidiomycota (Hebeloma) by a poorly characterised putative ECM Basidiomycota due to contamination. Root and fungal expression involved transcripts encoding carbohydrate/amino acid (C/N) dialogue whereas bacterial gene expression included the apparatus necessary for biofilm interaction and direct reduction of contamination stress, a potential bacterial currency for a role in tripartite mutualism. Unmistakable within the metatranscriptome is the degree to which the landscape of rhizospheric biology, particularly the important but predominantly uncharacterised fungal genetics, is yet to be discovered.

Keywords: Metatranscriptomics; Microbiome; Phytoremediation; Rhizosphere; Salix.


Conflict of interest statement

Ethics approval and consent to participate

Not applicable

Consent for publication

Not applicable

Competing interests

The authors declare that they have no competing interests.

Publisher’s Note

Springer Nature remains neutral with regard to jurisdictional claims in published maps and institutional affiliations.

Figures

Fig. 1
Fig. 1
Total annotation. Annotation of the entire transcriptome assembly (including non-differentially expressed contigs). Bars representing Bacteria, Domain, Eukaryota, Viridiplantae and Fungi are selected as a useful overview of the diversity within the transcriptome. While bars represent data normalised to 100%, only ~ 65% of the sequenced reads were successfully mapped to the assembled transcriptome (so are overlooked here) and 34% of assembled contigs had no similarity to known sequences (so are again overlooked). Full annotation is provided in Additional file 4 and an interactive Krona of total annotation is available at: https://github.com/gonzalezem/Tripartite_Metatranscriptomics_article
Fig. 2
Fig. 2
Origin of differentially expressed contigs. MA plots (ac) of de novo assembled transcriptome; y-axis represents fold change (FC, log2) between contaminated (+ive) to non-contaminated conditions (−ive), and the x-axis represents mean normalised (EdgeR) counts per million (log2 CPM). Plot a all contigs (including non-DE) and b DE contigs only; coloured by annotation including contours to represent contig density relative within each group. c Individual MA plots of differentially expressed (DE) contigs annotated from Viridiplantae, Fungi, Metazoa, Bacteria and Unknown (no known similar sequences) are included for clarity. Data patterning from contamination-driven shifts in the community are observable (a) prior to any annotation. An epsilon factor is added in place of zero abundance where contigs are present in only one condition to allow visualisation and abundance comparison (as fold change would be infinite); the presence or absence of contigs (due to contamination) is biologically informative. d All DE contigs represented within a Krona graph [47]; the proportion of each taxonomic grouping is defined by the number of distinct contigs, whereas the colour represents the relative abundance (transcripts per million, tpm) of transcripts in each taxon. An interactive Krona graph to assist navigation of DE contig annotation origin is available at: https://github.com/gonzalezem/Tripartite_Metatranscriptomics_article. A full contig list including expression information, annotation (1° and 2°) and gene ontology is provided in Additional file 4 whereas DE only contigs are provided in Additional file 9
Fig. 3
Fig. 3
Salix purpurea differential expression (DE) transcript distribution and abundance (transcripts per million, tpm) weighted fold change (log2). Top: fold change (FC log2) distribution of DE genes contaminated (black) and non-contaminated (gold). Bottom: mean transcript counts (tpm) difference between conditions against fold change per DE contig. The highly abundant transcripts discussed within the text are labelled. A full DE transcript list including expression data, functional description (if available), gene ontology terms (if available) and secondary annotation (if available) is provided in Additional file 5. PIP plasma membrane intrinsic protein (aquaporin), GST glutathione S-transferase
Fig. 4
Fig. 4
Taxonomy of fungal differential expression and secondary annotation. MA plots of de novo assembled transcriptome; y-axis represents fold change (FC, log2) between contaminated (+ive) to non-contaminated conditions (−ive), and the x-axis represents mean normalised (EdgeR) counts per million (log2 CPM). Contours representing relative DE contig density. a DE contigs annotated from fungi with Ascomycota (red) and Basidiomycota (blue), b DE Ascomycota contigs with genera annotating > 20 contigs highlighted and c DE Basidiomycota contigs with genera annotating > 20 contigs highlighted. d Secondary annotation of each DE fungal contig illustrating alternative, equally valid annotation [2] from other species (presented as genera for clarity). Genera with correspondences > 20 are presented and coloured by DE direction (more abundant in contaminated roots = black; more abundant in non-contaminated roots = gold). Agaricles phylogeny (an order of Agaricomycetes) is provided to visualise expression profiles against relatedness, with clade II (Pluteoid), IV (Marasmoid), V (Tricholomatoid) and VI (Agaricoid) structure (taken from Matheny et al. [86]). An interactive chord diagram and Krona graph to assist more comprehensive navigation of taxonomy and fungal secondary annotation are available at: https://github.com/gonzalezem/Tripartite_Metatranscriptomics_article. A full fungal DE contig list including expression information, annotation (1° and 2°) and gene ontology is provided in Additional file 6 whereas a full list of Basidiomycota DE contigs upregulated in roots of contaminated trees is provided in Additional file 7
Fig. 5
Fig. 5
Basidiomycota differential expression (DE) transcript distribution, abundance (transcripts per million, tpm) weighted fold change (log2) and contigs present in only one condition. Top: fold change (FC log2) distribution of DE genes contaminated (black) and non-contaminated (gold). Middle: mean counts (tpm) difference between conditions against fold change per DE contig. The highly abundant transcripts discussed within the text are labelled. A full DE transcript list including expression data, functional description (if available), gene ontology terms (if available) and secondary annotation (if available) is provided in Additional file 7. MST monosaccharide transporter, AMT ammonium transporter, PMP3 plasma membrane proteolipid 3. Bottom: contigs present in only one condition (termed infinity genes in Additional files)
Fig. 6
Fig. 6
Bacterial contigs, total and differentially expressed (DE) transcript origin. Krona graphs [47] represent a total annotation of bacterial transcripts (including non-DE) and b annotation of DE bacterial transcripts. The proportion of each taxonomic grouping is defined by the number of unique transcripts, whereas the colour represents the relative abundance (transcripts per million tpm) of transcripts in each taxon. A full contig list including expression data, functional description (if available), gene ontology terms (if available) and secondary annotation (if available) is provided in Additional file 4. A list of bacterial DE transcripts (including protein coding sequences within polycistronic contigs annotated with transdecoder is provided in Additional file 10. Interactive versions of these Krona graphs available at: https://github.com/gonzalezem/Tripartite_Metatranscriptomics_article
Fig. 7
Fig. 7
A selection of differentially expressed bacterial putative operons in higher abundance in roots of contaminated trees (and discussed in the text). Bacterial contigs were first identified within the assembly as best annotated with a single bacterial protein. To find multiple potential coding regions within bacterial polycistronic sequences, we used TransDecoder software (https://transdecoder.github.io/) [3] with default parameters. A final hand annotation step was included to remove a minor number of overlapping uncharacterised ORFs. Precedence of transcriptional unit structure (putative operons) was verified in all cases against the database of prokaryotic operons (DOOR [48]) unless otherwise stated. The in-house contig label is presented with the structure of the putative operon annotated using E. coli nomenclature. The three putative operons c60225_g2_i5, c60225_g2_i7 and c60225_g2_i8 all include the transposable element insH9, similar read coverage may falsely conjoin up- and downstream DE sequence combinations around the common insert. A full list of bacterial DE putative operons (transcriptional units) including expression data, functional description (if available), gene ontology terms (if available) and secondary annotation (if available) is provided in Additional file 10

References

    1. Stappenbeck TS, Virgin HW. Accounting for reciprocal host–microbiome interactions in experimental science. Nature. 2016;534:191–199. doi: 10.1038/nature18285. - DOI - PubMed
    1. Brereton NJB, Gonzalez E, Marleau J, Nissim WG, Labrecque M, Joly S, Pitre FE. Comparative transcriptomic approaches exploring contamination stress tolerance in Salix sp. reveal the importance for a metaorganismal de novo assembly approach for nonmodel plants. Plant Physiol. 2016;171:3–24. doi: 10.1104/pp.16.00090. - DOI - PMC - PubMed
    1. Haas BJ, Papanicolaou A, Yassour M, Grabherr M, Blood PD, Bowden J, Couger MB, Eccles D, Li B, Lieber M, et al. De novo transcript sequence reconstruction from RNA-seq using the Trinity platform for reference generation and analysis. Nat Protoc. 2013;8:1494–1512. doi: 10.1038/nprot.2013.084. - DOI - PMC - PubMed
    1. Henner P, Schiavon M, Morel JL, Lichtfouse E. Polycyclic aromatic hydrocarbon (PAH) occurrence and remediation methods. Analusis. 1997;25:M56–M59.
    1. De Sousa C. Contaminated sites: the Canadian situation in an international context. J Environ Manag. 2001;62:131–154. doi: 10.1006/jema.2001.0431. - DOI - PubMed

Publication types

MeSH terms