. 2018 Jul:364:129-141.
doi: 10.1016/j.heares.2018.03.014. Epub 2018 Mar 13.

Paraquat initially damages cochlear support cells leading to anoikis-like hair cell death

Affiliations

Paraquat initially damages cochlear support cells leading to anoikis-like hair cell death

Jianhui Zhang et al. Hear Res. 2018 Jul.

Abstract

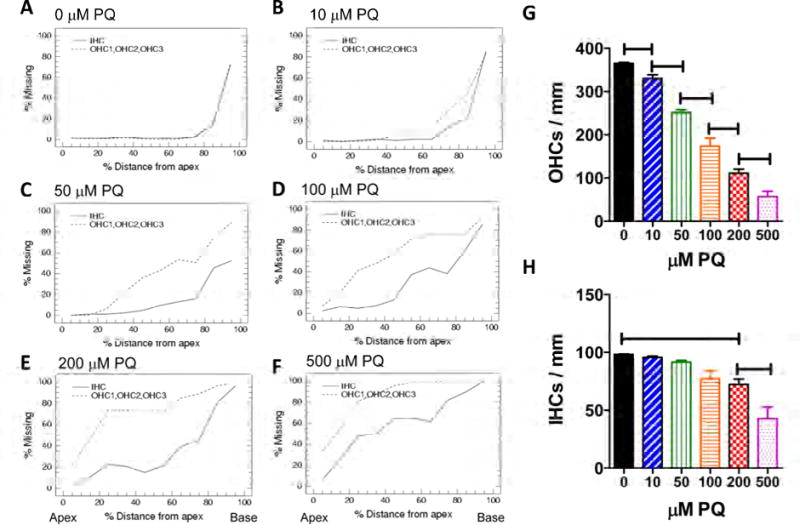
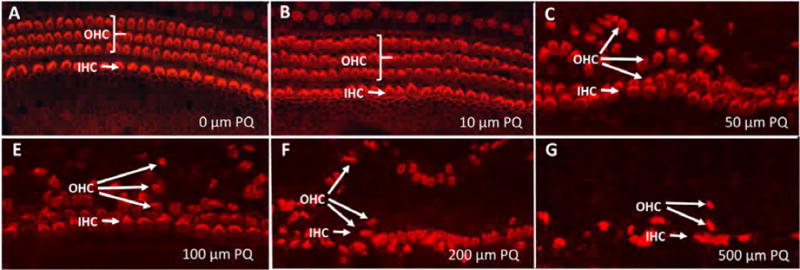
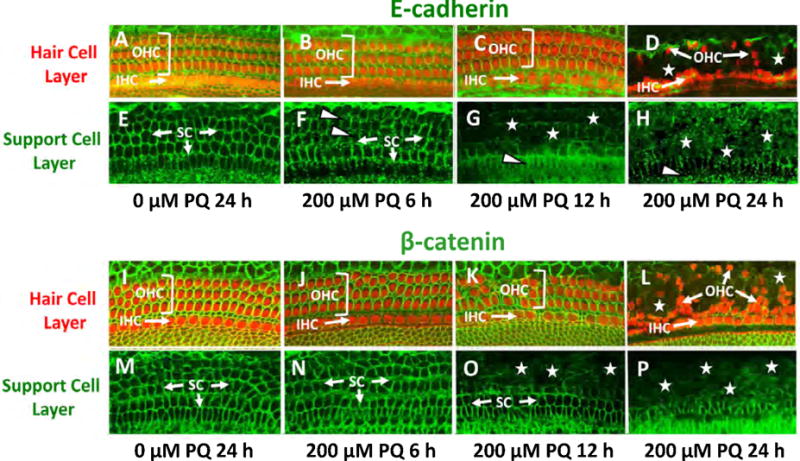
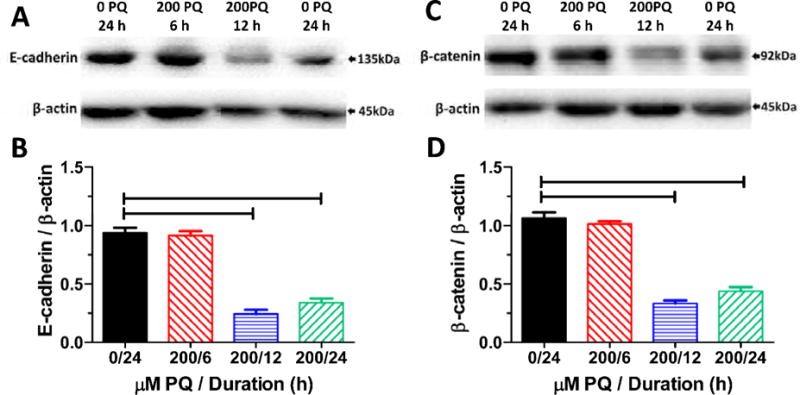
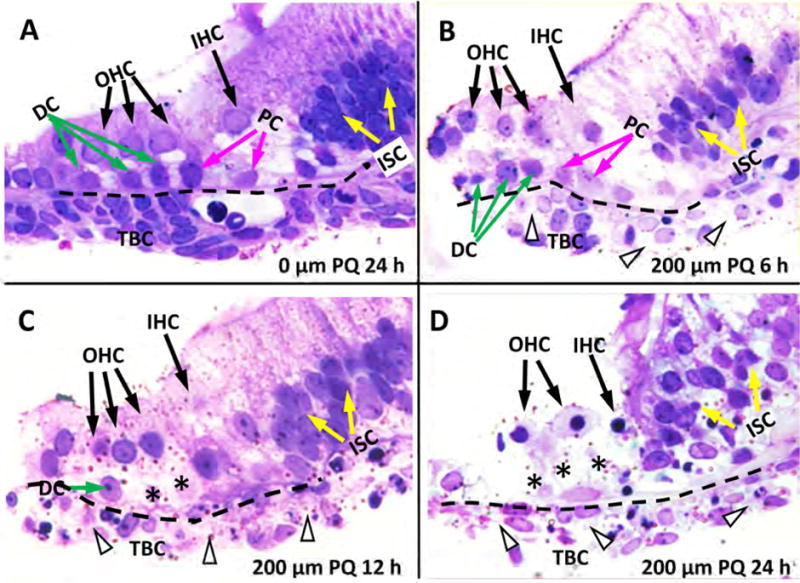
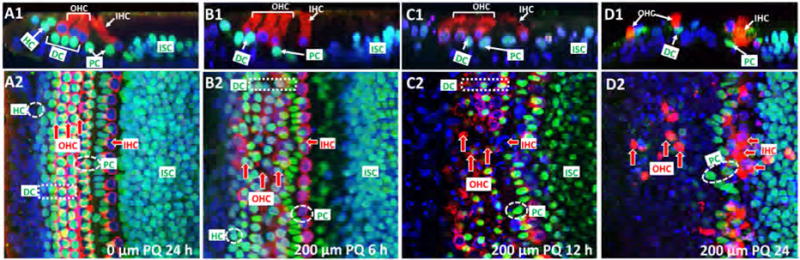
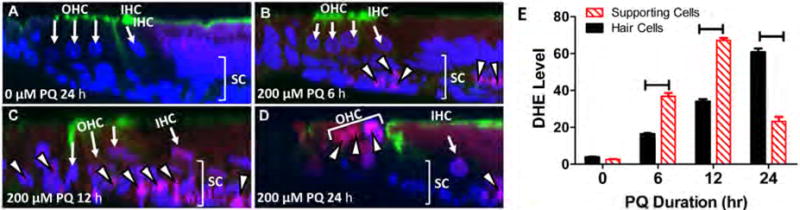
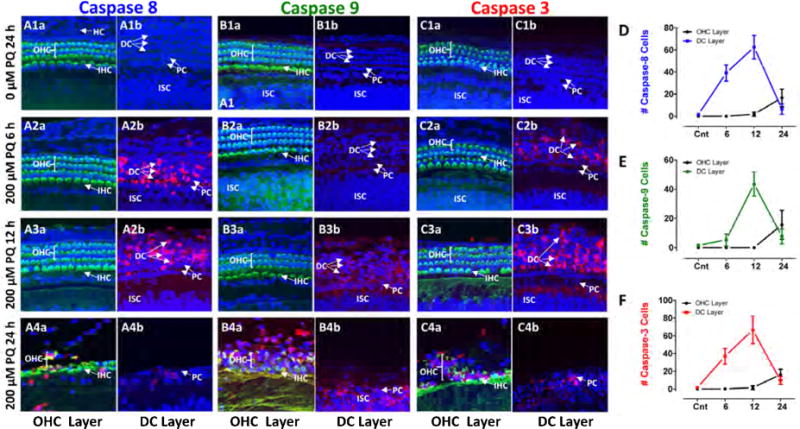
Paraquat (PQ), one of the most widely used herbicides, is extremely dangerous because it generates the highly toxic superoxide radical. When paraquat was applied to cochlear organotypic cultures, it not only damaged the outer hair cells (OHCs) and inner hair cells (IHCs), but also caused dislocation of the hair cell rows. We hypothesized that the dislocation arose from damage to the support cells (SCs) that anchors hair cells within the epithelium. To test this hypothesis, rat postnatal cochlear cultures were treated with PQ. Shortly after PQ treatment, the rows of OHCs separated from one another and migrated radially away from IHCs suggesting loss of cell-cell adhesion that hold the hair cells in proper alignment. Hair cells dislocation was associated with extensive loss of SCs in the organ of Corti, loss of tympanic border cells (TBCs) beneath the basilar membrane, the early appearance of superoxide staining and caspase-8 labeling in SCs below the OHCs and disintegration of E-cadherin and β-catenin in the organ of Corti. Damage to the TBCs and SCs occurred prior to loss of OHC or IHC loss suggesting a form of detachment-induced apoptosis referred to as anoikis.

Keywords: Anoikis; Caspase-8; E-cadherin; Paraquat; Superoxide; β-catenin.


Conflict of interest statement

Declarations of interest: none

Figures

Figure 1
Figure 1
(A–F) Mean (n=6 cochlea per group) cochleograms showing the percent missing OHCs (dashed line) and IHCs (solid line) as a function of percent distance from the apex of the cochlea. Cochlear organotypic cultures treated for 24 h with increasing concentrations of PQ ranging from 0 to 500 μM as indicated above each panel. (G) Mean (+SEM, n=6 cochlea per group) OHC density (3 rows OHC/mm) and (H) mean (+SEM, n=6 cochlea per group) IHC density (IHC/mm) as a function of PQ dose (0 to 500 μM). Lines show PQ treatments in which the mean hair cell densities were significantly (p< 0.05) different from the next lowest dose of PQ.
Figure 2
Figure 2
Representative surface preparations from cochlear explants treated for 24 h with PQ doses from 0–500 μM as indicates in panels A–G. (A) Control culture illustrating stereocilia and cuticular plate of three rows of outer hair cells (OHC) and one row of inner hair cells (IHC) labeled with Alexa Fluor 555-conjugated phalloidin that labels F-actin expressed in stereocilia and hair cell cuticular plate. Note orderly rows of OHCs and IHCs in panels A–B and disorderly rows of hair cells and dislocated OHC rows in panels C–G.
Figure 3
Figure 3
Representative radial sections (3 μm) of cochlear organotypic cultures stained with toluidine blue. (A) Control (0 μM) sample cultured for 24 h showing three rows of outer hair cells (OHC), one row of inner hair cells (IHC), Deiters cells (DC, green arrow), inner and outer pillar cells (PC, pink arrow), inner sulcus cells (ISC, white arrow), basilar membrane (dashed line) and tympanic border cells (TBC) beneath the basilar membrane. (B) Section from culture treated for 6 h with 200 μM PQ. OHC and IHC still present, missing or severely shrunken TBC indicated by arrowhead beneath the basilar membrane. Note pale cytoplasm in remaining TBC and shrunken DC with pale cytoplasm. (C) Section from culture treated for 12 h with 200 μM PQ. IHC and OHC still present; missing DC labeled with *; many missing or severely shrunken TBC (arrowhead). (D) Section from culture treated with 200 μM PQ for 24 h. Remaining IHC and OHC are pale and shrunken. Note missing DC (*) and TBC (arrowhead).
Figure 4
Figure 4
Early support cell destruction. Z-plane section and surface view of cochlear explants cultured for 24 h without PQ (A1, A2, 0 μM) or cultured with 200 μM PQ for 6 h (B1, B2), 12 h (C1, C2) or 24 h (D1, D2). Specimens stained with To-Pro-3 (blue), which labels nuclei, a SOX2 antibody (green) that labels support cells and a myosin VI antibody (red) that labels the cytoplasm of outer hair cells (OHC) and inner hair cells (IHC). Hensen cells (HC), Deiters cells (DC), pillar cells (PC) and inner sulcus cells (ISC) show strong SOX2/ToPro-3 (turquoise=green/blue merge) labeling. (A1) In normal explants, HC are lateral to OHC, DCs are below OHC and PC are below first OHC row and IHC. (A2) Surface image stack shows orderly rows of OHC and underlying DC (turquoise with red fringe) and IHC (red cytoplasm, blue nucleus). (B1, B2) After 6 h treatment with 200 μM PQ, many HC and a few DC are missing. Most OHC and IHC are present. (C1, C2) After 12 h treatment with 200 μM PQ, most DC and few OHC and IHC are missing. (D1, D2) After 24 h treatment with 200 μM PQ, most support cells and OHC are missing near the lateral edge of the epithelium. Some IHC and PC are present in an irregular row bordering the ISC region.
Figure 5
Figure 5
Detection of superoxide by DHE fluorescent labeling. Specimens labeled with To-Pro-3 to label nuclei (blue), DHE (red) or Alexa 488-conguated phalloidin (green) to label the stereocilia and cuticular plate of hair cells. (A) Z-plane section from untreated cochlear explant cultured for 24 h shows negligible DHE fluorescent labeling in support cell layer (SC, bracket) and outer hair cells (OHCs) and inner hair cells (IHCs). (B) Treatment for 6 h with 200 μM induces DHE fluorescence (fuchsia color represents overlap of red DHE and blue To-Pro-3, white arrowhead) mainly in SC layer beneath the hair cells including cells beneath the basilar membrane. (C) Treatment for 12 h with 200 μM PQ induces strong DHE fluorescence in SC layer (bracket) including cells beneath the OHC and IHC and cells beneath the basilar membrane. (D) Treatment for 24 h with 200 μM PQ induces DHE fluorescence in OHC region, but little DHE fluorescence in the SC layer; destruction of support cells in deeper layers of the epithelium eliminates fluorescence from this region. (E) Mean gray level measures of superoxide in cochlear explants in untreated group cultured for 24 h, 200 μM PQ treatment for 6 h, 12 h, and 24 h groups. Horizontal lines identify between hair cells and supporting cells differences that were statistically significant (Newman-Keuls, p<0.05).
Figure 6
Figure 6
Caspase expression appears in Deiters cells before hair cell layer. Confocal images from the OHC layer and DC layers of cochlear explants. Alexa-488 conjugated phalloidin (green) used detect actin present in stereocilia and cuticular plate; To-Pro-3 (blue) used to label nuclei and flurogenic probe to detect activated (A1–4) caspase-8, (B1–4) caspase-9 and (C1–4) caspase-3 (C1–4) (red). Representative samples from the middle of the cochlea from control explant 24 h (0 μM PQ, top row) and explants treated with 200 μM PQ for 6 h (second row from top), 12 h (third row from top) and 24 h (bottom row). Caspase-8 (A2b) and to a lesser extent caspase-3 (C2b) first expressed in DC layer after 6 h of PQ treatment; caspase-8, -9 and -3 expression in OHC layer occurred after 24 h of PQ treatment (A4a, B4a, C4a), but many OHC already missing at this time (see Figure 3E). Caspase-9 expression first observed in DC layer (B3b). Mean (n=5, +/− SD) numbers of caspase-8 (D), caspase-9 (E) and caspase-3 (F) cells present in OHC layer and DC layer in control explants (0 μM PQ, 24 h) and explants treated with 200 μM PQ for 6, 12 or 24 h. Note robust increase in caspase-8 and caspase-3 in DC layer after 6 h PQ treatment. Increase in caspase-8, -9 and -3 expression in OHC layer occurred after 24 PQ, but many OHC were already missing at this time (Figure 3E).
Figure 7
Figure 7
PQ suppresses E-cadherin and β-catenin immunolabeling. (A–E) Cochlear explants immunolabeled with antibody against E-cadherin (green) and Alexa Fluor 555-conjugated phalloidin (red) which labels F-actin that is heavily expressed in the hair cell cuticular plate. Confocal images taken from the upper hair cell layer (top row) and lower supporting cell layer (2nd row from top) of a control explant cultured for 24 h (A, E) and explants treated with 200 mM PQ for 6 h (B, F), 12 h (C, G) and 24 h (D, H). (A) In upper hair cell layer of a control explant, phalloidin labled outer hair cells (OHC) and inner hair cells (IHC) (red/orange) are surrounded by E-cadherin (green). (D) After 24 h PQ treatment, most IHCs were present, many OHC were missing and most E-cadherin labeling had disappeared. (E) In the support cell layer, rings of E-cadherin were present in the SCs (arrows) in the control culture, but in the culture treated with PQ for 6 h (SC, green) the ring of E-cadherin was discontinuos and crenulated in some regions (arrowheads). (G–H) After 6 h and 12 h PQ treatment, much of the E-cadherin had disappeared. (I–P) Cochlear explants immunolabeled with antibodies against β-catenin (green) and Alexa Fluor 555-conjugated phalloidin (red) which labels F-actin that is heavily expressed in the hair cell cuticular plate. Confocal images taken from the upper hair cell layer (2nd row from bottom) and lower supporting cell layer (bottom row) of a control explant (I, M) cultured for 24 h and explants treated with 200 mM PQ for 6 h (J, N), 12 h (K, O) and 24 h (L, P). (I) In upper hair cell layer of control, the phalloidin-labled outer hair cells (OHC) and inner hair cells (IHC) (red/orange) were surrounded by β-catenin (green). (L) After 24 h PQ treatment, most IHCs were present, but many OHC were missing and most β-catenin had disappeared. (M–P) In the support cell layer, rings of β-cadherin were present in the SCs in the control culture and PQ culture treated for 6 h (SC, arrow, green). (O) After 12 h PQ treatment, the rings of β-cadherin had started to disappear in the OHC region and (P) after 24 h PQ treatment, much of the β-cadherin was missing except near the IHC region.
Figure 8
Figure 8
(A) Western blots of E-cadherin and β-actin obtained from control explant cultured for 24 h (0 PQ, 24 h) and explants treated with 200 μM PQ and cultured for 6, 12 or 24 h. (B) Mean (SEM, n=3 replicates/condition, 6 or more cochlear/measurement) values of E-cadherin relative to β-actin in controls explants (0 PQ, 24 h) and explants treated with 200 μM PQ for 6, 12 or 24 h. (C) Western blots of β-catenin and β-actin obtained from control explants cultured for 24 h (0 PQ, 24 h) and explants treated with 200 μM PQ and cultured for 6, 12 or 24 h. (D) Mean (SEM, n=3 replicates/condition; 6 or more cochlea/measurement) values of β-catenin relative to β-actin in controls explants (0 PQ, 24 h) and explants treated with 200 μM PQ for 6, 12 or 24 h. Horizontal bars identify PQ treatment durations that were significantly different from controls (p<0.05).

Similar articles

Cited by

References

    1. Anderson KD, Scerri GV. A case of multiple skin cancers after occupational exposure to pesticides. Br J Dermatol. 2003;149:1088–9. - PubMed
    1. Assreuy J, Cunha FQ, Epperlein M, Noronha-Dutra A, O’Donnell CA, Liew FY, Moncada S. Production of nitric oxide and superoxide by activated macrophages and killing of Leishmania major. Eur J Immunol. 1994;24:672–6. - PubMed
    1. Baltazar MT, Dinis-Oliveira RJ, de Lourdes Bastos M, Tsatsakis AM, Duarte JA, Carvalho F. Pesticides exposure as etiological factors of Parkinson’s disease and other neurodegenerative diseases–a mechanistic approach. Toxicol Lett. 2014;230:85–103. - PubMed
    1. Berry C, La Vecchia C, Nicotera P. Paraquat and Parkinson’s disease. Cell Death Differ. 2010;17:1115–25. - PubMed
    1. Bertsias GK, Katonis P, Tzanakakis G, Tsatsakis AM. Review of clinical and toxicological features of acute pesticide poisonings in Crete (Greece) during the period 1991-2001. Med Sci Monit. 2004;10:CR622–7. - PubMed

Publication types

MeSH terms