. 2018 Apr;28(4):497-508.
doi: 10.1101/gr.229518.117. Epub 2018 Mar 21.

Genome-wide determinants of sequence-specific DNA binding of general regulatory factors

Affiliations

Genome-wide determinants of sequence-specific DNA binding of general regulatory factors

Matthew J Rossi et al. Genome Res. 2018 Apr.

Abstract

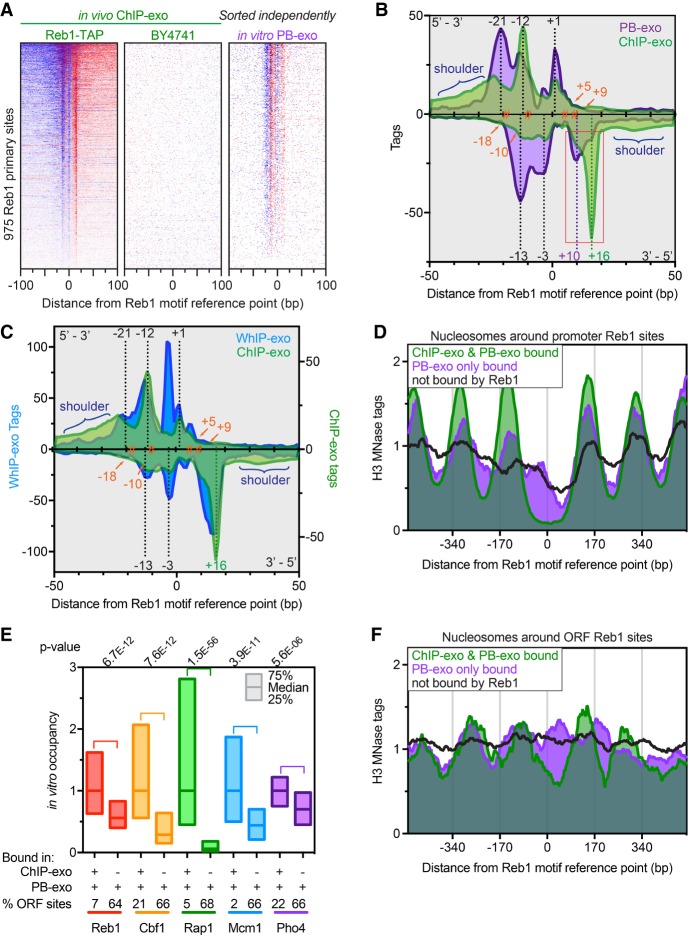
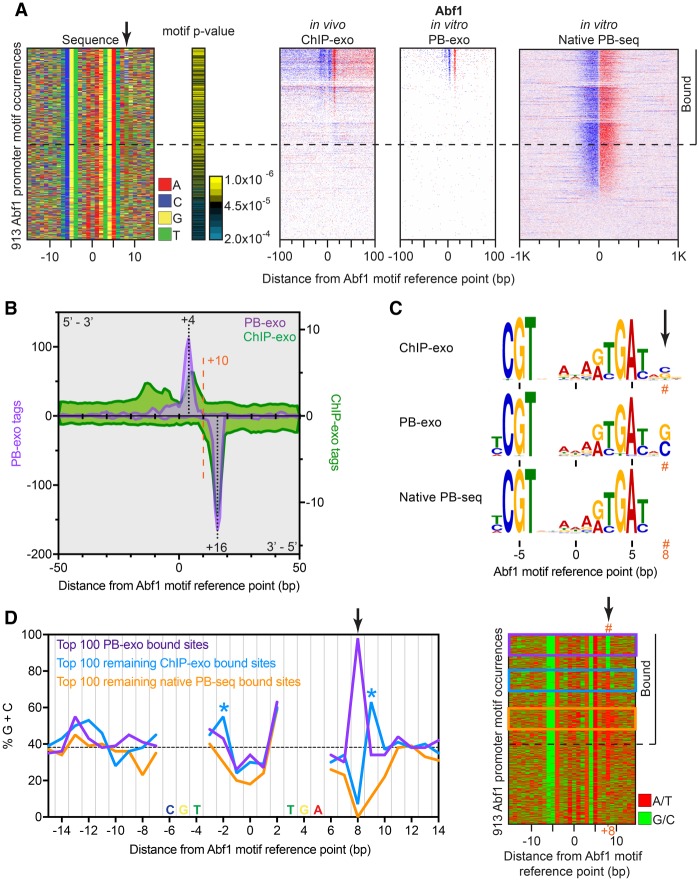
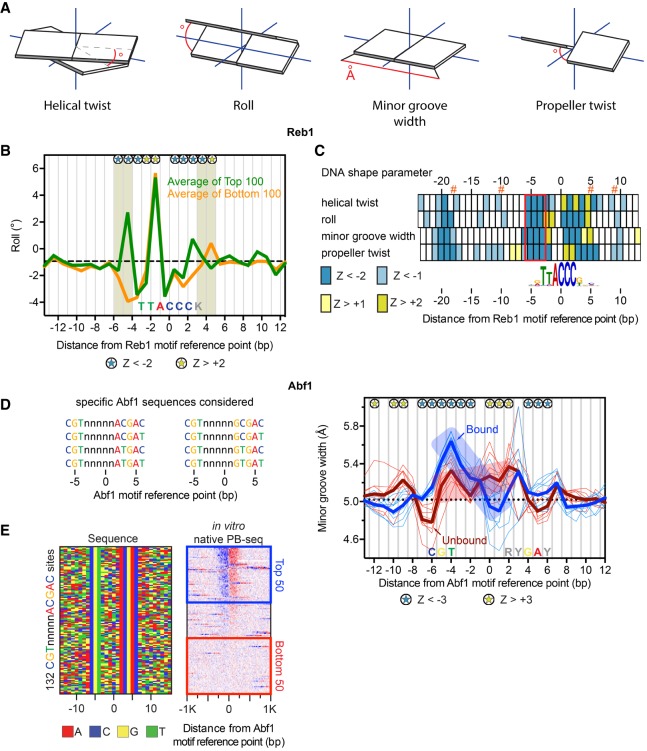
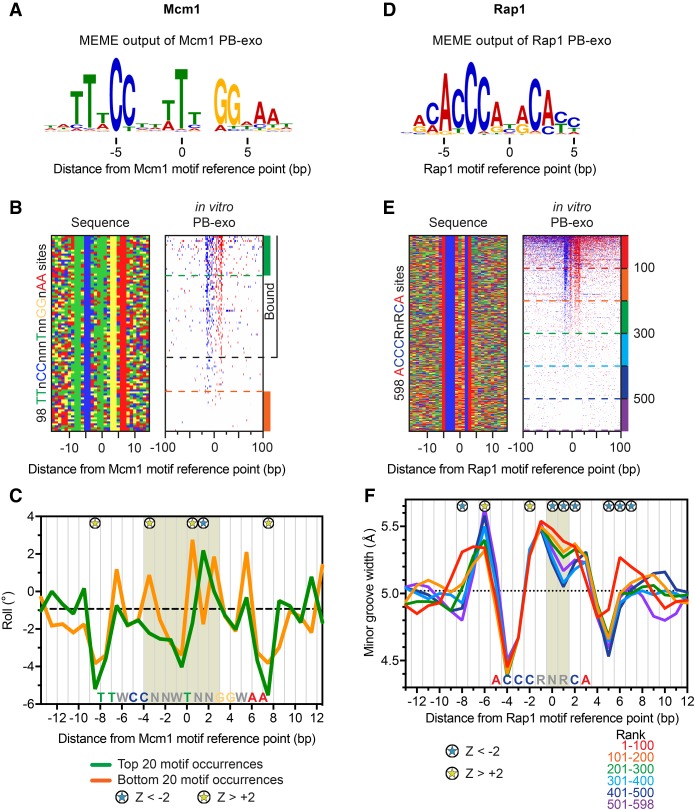
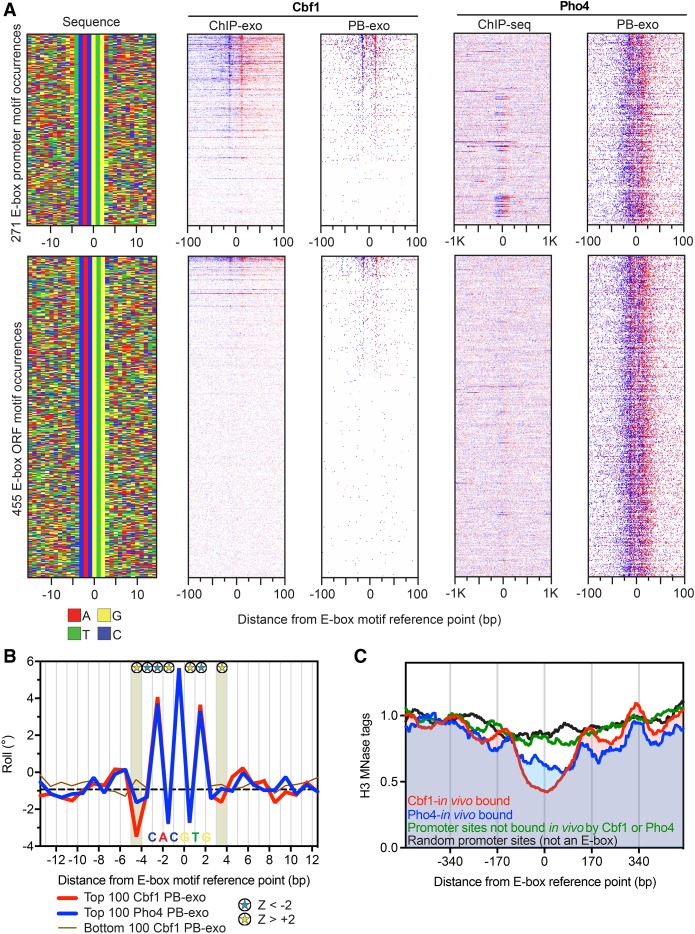
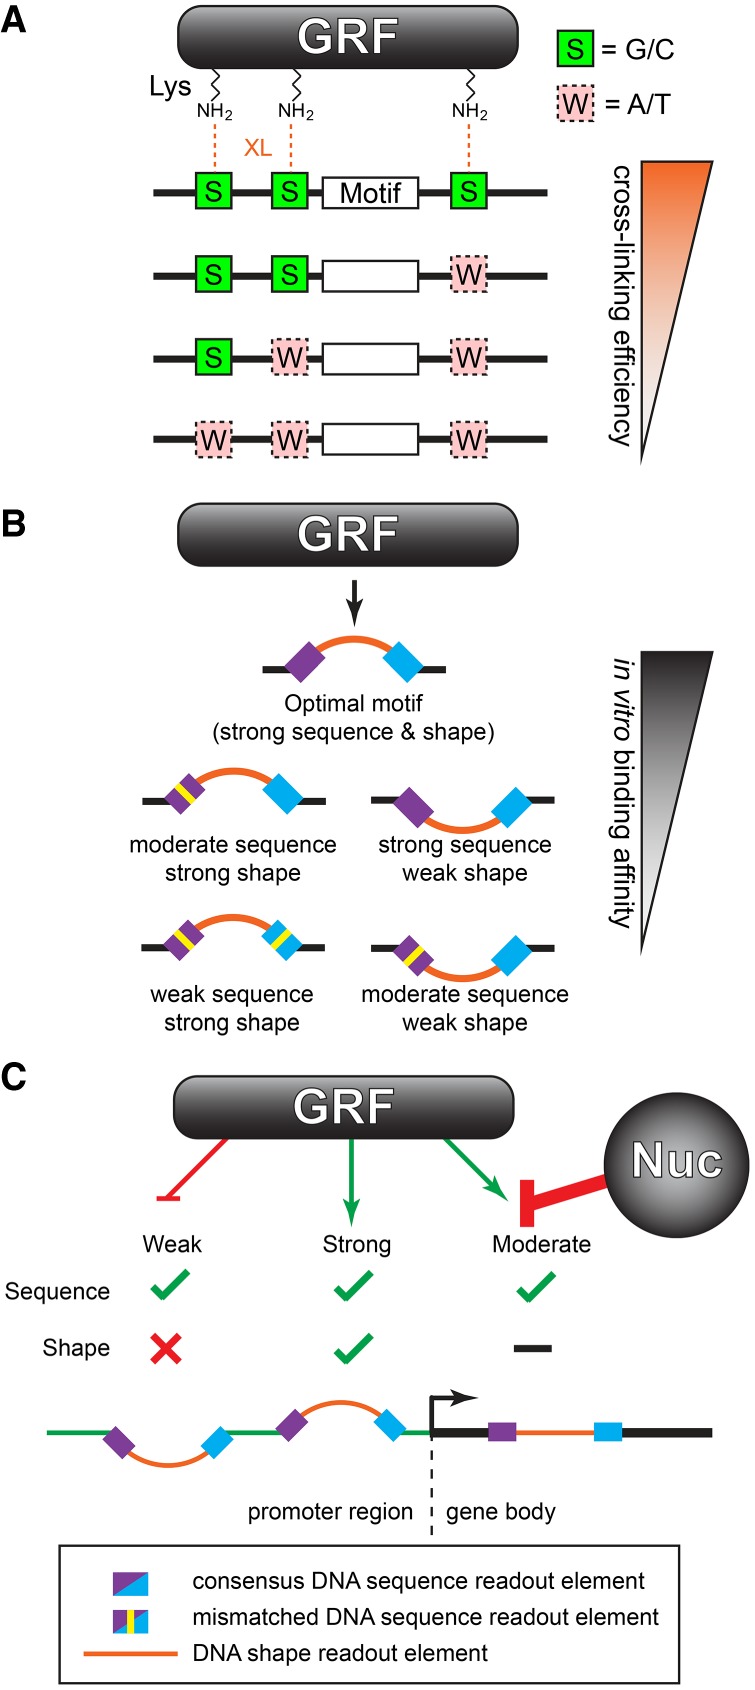
General regulatory factors (GRFs), such as Reb1, Abf1, Rap1, Mcm1, and Cbf1, positionally organize yeast chromatin through interactions with a core consensus DNA sequence. It is assumed that sequence recognition via direct base readout suffices for specificity and that spurious nonfunctional sites are rendered inaccessible by chromatin. We tested these assumptions through genome-wide mapping of GRFs in vivo and in purified biochemical systems at near-base pair (bp) resolution using several ChIP-exo-based assays. We find that computationally predicted DNA shape features (e.g., minor groove width, helix twist, base roll, and propeller twist) that are not defined by a unique consensus sequence are embedded in the nonunique portions of GRF motifs and contribute critically to sequence-specific binding. This dual source specificity occurs at GRF sites in promoter regions where chromatin organization starts. Outside of promoter regions, strong consensus sites lack the shape component and consequently lack an intrinsic ability to bind cognate GRFs, without regard to influences from chromatin. However, sites having a weak consensus and low intrinsic affinity do exist in these regions but are rendered inaccessible in a chromatin environment. Thus, GRF site-specificity is achieved through integration of favorable DNA sequence and shape readouts in promoter regions and by chromatin-based exclusion from fortuitous weak sites within gene bodies. This study further revealed a severe G/C nucleotide cross-linking selectivity inherent in all formaldehyde-based ChIP assays, which includes ChIP-seq. However, for most tested proteins, G/C selectivity did not appreciably affect binding site detection, although it does place limits on the quantitativeness of occupancy levels.


Figures

Figure 1.
Figure 1.
Genome-wide in vitro binding of Reb1. (A) Heat maps comparing ChIP-exo and PB-exo at 975 TTACCCK Reb1 primary sites (rows) (Rhee and Pugh 2011). Distances are from the underlined motif reference point. ChIP-exo of strain BY4741 shows background, with rows linked to the Reb1 ChIP-exo sort. In vitro PB-exo was sorted independently. Blue indicates tag 5′ ends located on the same strand as the motif, whereas red are located on the opposite strand. (B) Composite of tag 5′ ends for ChIP-exo (green) and PB-exo (purple) of Reb1 at 975 primary sites. Density above the x-axis represents tags on the motif strand, whereas opposite strand density is inverted below the x-axis. The orange hashtags represent prominent cross-linking points calculated by pairing adjacent peaks above and below the x-axis. Dashed black lines represent peaks that are common in ChIP-exo and PB-exo. Dashed green and purple lines represent the peaks that are enriched in ChIP-exo and PB-exo, respectively, and are highlighted by the red box. The blue brackets highlight the “shoulder” regions that contain higher cross-linking in the ChIP-exo samples. (C) Composite of tag 5′ ends for ChIP-exo (green) and WhIP-exo (blue) of Reb1 at Reb1 primary sites. Annotation descriptions and the ChIP-exo trace are the same as in B. (D) Composite plots of nucleosome midpoints generated by MNase H3 ChIP-seq at different groups of Reb1 motif occurrences located in promoters. (E) Relative occupancy at sites detected in both ChIP-exo and PB-exo assays (+/+) versus sites detected only by PB-exo (−/+) and the percentage of those sites located in ORFs for all proteins in this study (except Abf1). Abf1 was excluded because its G/C cross-linking bias made for a potentially misleading comparison. The 25th, 50th, and 75th percentiles are marked. The proteins are arranged, left to right, by their propensity to cause nucleosome depletion (Kaplan et al. 2009). (F) Composite plots of nucleosome midpoints generated by MNase H3 ChIP-seq at different groups of Reb1 motif occurrences located in ORFs.
Figure 2.
Figure 2.
Genome-wide in vitro Abf1 binding reveals formaldehyde G/C specificity. (A) The left panel shows a four-color plot representation of 30-bp sequences centered on the motif midpoint. Each row represents a motif occurrence that passed our FIMO threshold. The black arrow points to the calculated cross-linking point. The remaining panels show, for each assay, tag 5′ ends distributed around motif occurrences located in promoters and sorted first by PB-exo, then ChIP-exo, and finally native PB-seq tag counts. Rows are linked across all data sets. The horizontal dashed line demarcates our threshold for binding in at least one assay. Sites with tags below the dashed line were not considered bound, because the tags generally did not form peak pairs or were not particularly enriched above background. (B) Tag counts for ChIP-exo (green) and PB-exo (purple) for Abf1 at Abf1 motif occurrences. (C) MEME logos obtained from the top 500 peak-pairs from each assay. The orange hashtag represents the calculated cross-linking point. (D) Left panel, frequency of G/C within 30-bp sequences centered on the Abf1 motif midpoint for the top 100 sites bound in PB-exo (purple), the top 100 remaining sites bound in ChIP-exo but not PB-exo (blue), and the top 100 remaining sites bound in native PB-seq but not the other two assays (orange). Blue asterisks highlight alternate cross-linking sites observed in ChIP-exo. Frequencies occurring within the Abf1 motif were not plotted. The dashed black line indicates the background G/C content. Right panel, four-color plot representation of A/T (red) or G/C (green) for sequences centered on the motif reference point. Colored boxes represent groups used in the left panel.
Figure 3.
Figure 3.
Distinct DNA shape features help define Reb1 and Abf1 binding. (A) DNA shape parameters. The angle or distance reported for each parameter is indicated by red lines. (B) Line plots of variations in roll for top versus bottom 100 promoter Reb1 motif occurrences, defined by the sort in Supplemental Figure S3A. Dashed black line denotes genome-wide median. Blue and yellow stars represent positions with significant positive or negative roll (|Z| > 2, Mann-Whitney U test), respectively, for the top versus bottom 100. Shaded boxes highlight the nucleotides outside the core motif with significant shape differential. (C) Heat map representation of four DNA shape parameters for Reb1 from B. Z-scores are based on the Mann-Whitney U test. Orange hashtags indicate the location of Reb1 cross-linking points. The red box highlights the region of the motif with the greatest concentration of significant positions across all four DNA shape parameters. Helical twist and roll are inter-bp values. (D) List of specific sequences considered as exact Abf1 motif occurrences. (E) Four-color plot of sequences (left) centered on the motif midpoint for all instances of CGTnnnnnACGAC in promoters, representing one of the eight specific sequence configurations. (Right panel) Heat map of tags sorted by native PB-seq. The blue and red boxes indicate the top versus bottom 50 occupied sites. (F) Line plots of variations in minor groove width for Abf1 motif occurrences. Blue/bound or red/unbound thick lines represent the average of the thin lines, which reflect shape profiles for the eight individual Abf1 motif configurations. The dashed black line indicates the genome-wide median. Blue and yellow stars represent positions with significant larger or smaller minor groove width (|Z| > 3, Mann-Whitney U test), respectively, for the combined top versus bottom 400 sites. The position of the consensus Abf1 motif is labeled along the x-axis.
Figure 4.
Figure 4.
Influence of DNA shape on Mcm1/DNA and Rap1/DNA complex formation. (A) MEME logo obtained from the top 500 peak-pairs from Mcm1 PB-exo. (B, left panel) Four-color plot of sequences centered on the motif midpoint for all combined instances of TTnCCnnnTnnGGnAA in promoters or ORFs. (Right panel) Heat map of tags sorted by PB-exo. Sites above the black dashed line contain a peak pair. (C) Line plots of variations in roll for the top (green) versus bottom 20 (orange) motif occurrences. The dashed black line indicates the median roll of all DNA sequences. Blue and yellow stars represent positions with significant positive and negative roll (|Z| > 2, Mann-Whitney U test), respectively, for the top compared to the bottom sites. The position of the consensus Mcm1 motif is labeled along the x-axis. The tan shaded area indicates the nucleotides in the motif center that are bent in the structure presented in Supplemental Fig. S9A. (D) MEME logo obtained from the top 500 peak-pairs from Rap1 PB-exo. (E, left panel) Four-color plot of sequences centered on the motif midpoint for all combined instances of ACCCRnRCA in promoters or ORFs. (Right panel) Heat map of tags sorted by PB-exo. The dashed lines represent groups of 100 sites. (F) Line plots of variations in minor groove width for groups of 100 motif occurrences. Colored lines correspond to groups in E. The dashed black line indicates the genome-wide median. The position of the consensus Rap1 motif is labeled along the x-axis. Relevant shape effects are highlighted by shaded area. Blue and yellow stars represent positions with significant large or small minor groove width (|Z| > 2, Mann-Whitney U test), respectively, for the top 100 sites compared to the set of sites ranked 301–400 (light blue).
Figure 5.
Figure 5.
Genome-wide in vitro Cbf1 and Pho4 binding locations. (A) Annotation descriptions are the same as in Figure 2A, except for Cbf1 and Pho4. Data are sorted by Cbf1 PB-exo tag counts ±30 bp from the motif center, and rows across all data sets are linked. The Pho4 ChIP-seq data under phosphate starvation is from Zhou and O'Shea (2011). (B) Line plots of variations in roll for the top (red) versus top (blue) 100 Pho4 PB-exo-bound E-box motif occurrences. The bottom (brown) 100 Cbf1 PB-exo motif occurrences are also shown but were not included in the statistical analysis. The dashed black line indicates the genome-wide median. Blue and yellow stars represent positions with significant large or small roll (|Z| > 2, Mann-Whitney U test), respectively. The shaded area designates the positions just outside the core motif that possessed significant differences in DNA shape. The position of the consensus E-box motif is labeled along the x-axis. (C) Composite plots of nucleosome dyads generated by MNase H3 ChIP-seq for different groups of E-box motif occurrences. The data were collected from cells grown in YPD, but the Pho4-in vivo bound sites were defined by data collected under phosphate starvation conditions.
Figure 6.
Figure 6.
Genome-wide determinants of sequence-specific DNA binding. (A) Formaldehyde cross-linking (XL) efficiency is influenced by the fortuitous occurrence of G/C in the vicinity of lysine (Lys) side chains of the protein that interact with DNA. (B) GRF binding is specified by a combination of DNA sequence and shape readout. (C) Functional GRF binding sites having proper sequence and shape typically reside in promoters. Weaker sites may exist outside of promoters but are rendered inaccessible by chromatin. Strong consensus motifs that lack proper shape features do not bind GRFs and so may arise anywhere in the genome without consequence.

References

    1. Abe N, Dror I, Yang L, Slattery M, Zhou T, Bussemaker HJ, Rohs R, Mann RS. 2015. Deconvolving the recognition of DNA shape from sequence. Cell 161: 307–318. - PMC - PubMed
    1. Albert I, Wachi S, Jiang C, Pugh BF. 2008. GeneTrack—a genomic data processing and visualization framework. Bioinformatics 24: 1305–1306. - PMC - PubMed
    1. Badis G, Chan ET, van Bakel H, Pena-Castillo L, Tillo D, Tsui K, Carlson CD, Gossett AJ, Hasinoff MJ, Warren CL, et al. 2008. A library of yeast transcription factor motifs reveals a widespread function for Rsc3 in targeting nucleosome exclusion at promoters. Mol Cell 32: 878–887. - PMC - PubMed
    1. Bai L, Ondracka A, Cross FR. 2011. Multiple sequence-specific factors generate the nucleosome-depleted region on CLN2 promoter. Mol Cell 42: 465–476. - PMC - PubMed
    1. Bailey TL, Boden M, Buske FA, Frith M, Grant CE, Clementi L, Ren J, Li WW, Noble WS. 2009. MEME SUITE: tools for motif discovery and searching. Nucleic Acids Res 37: W202–W208. - PMC - PubMed

Publication types

MeSH terms

Substances