. 2018 May 1;200(9):3087-3099.
doi: 10.4049/jimmunol.1701179. Epub 2018 Mar 21.

Relative Contributions of B Cells and Dendritic Cells from Lupus-Prone Mice to CD4+ T Cell Polarization

Affiliations

Relative Contributions of B Cells and Dendritic Cells from Lupus-Prone Mice to CD4+ T Cell Polarization

Seung-Chul Choi et al. J Immunol. .

Abstract

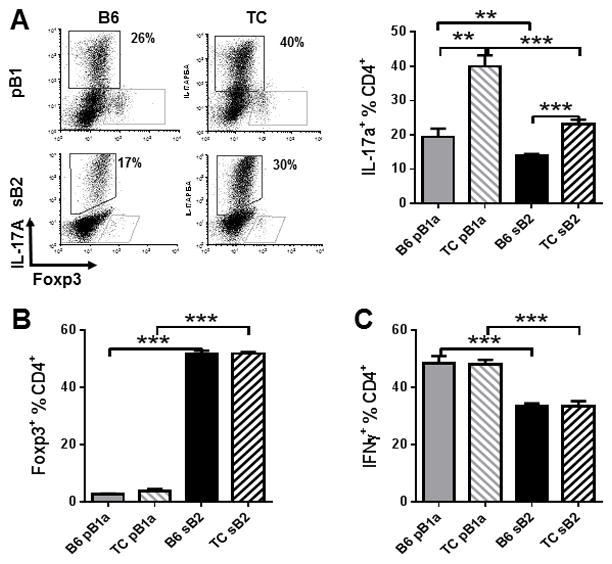
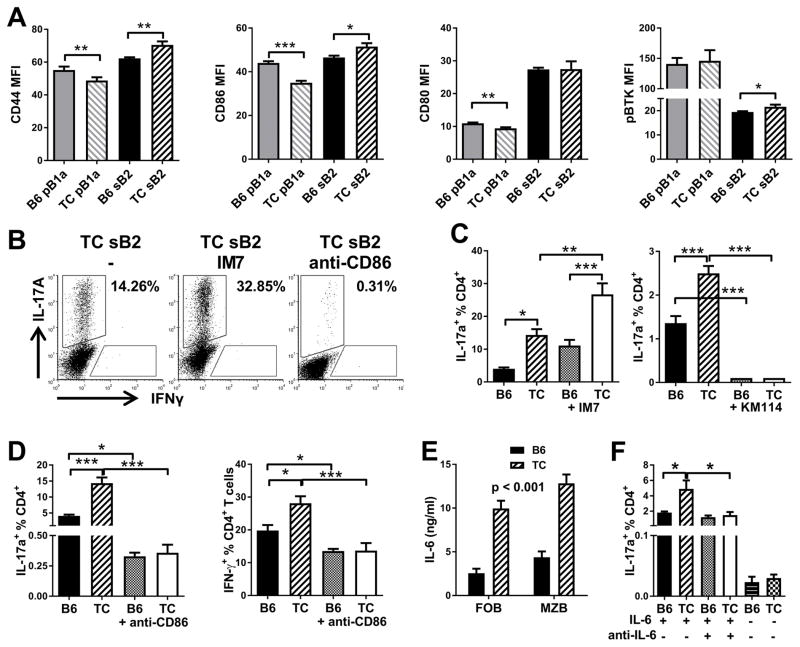
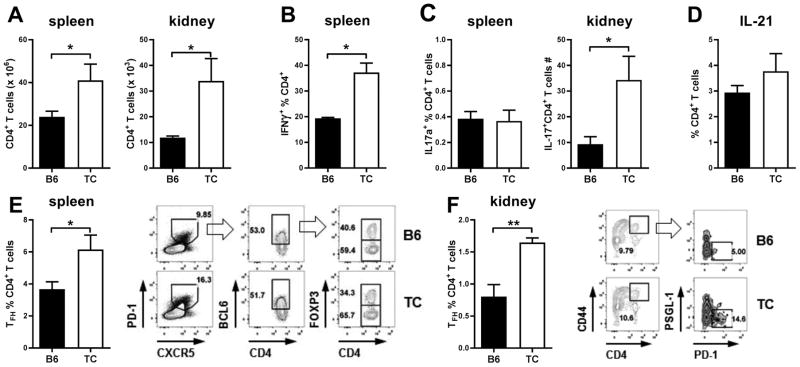
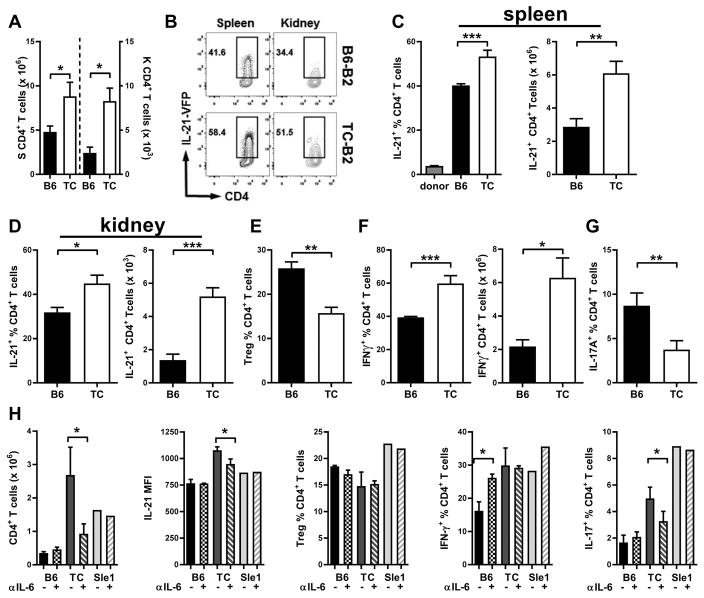
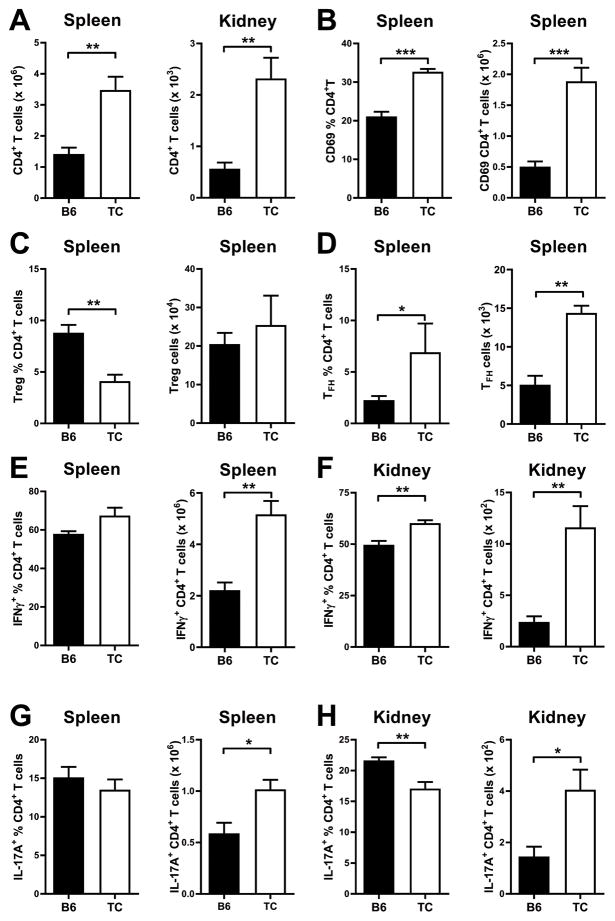
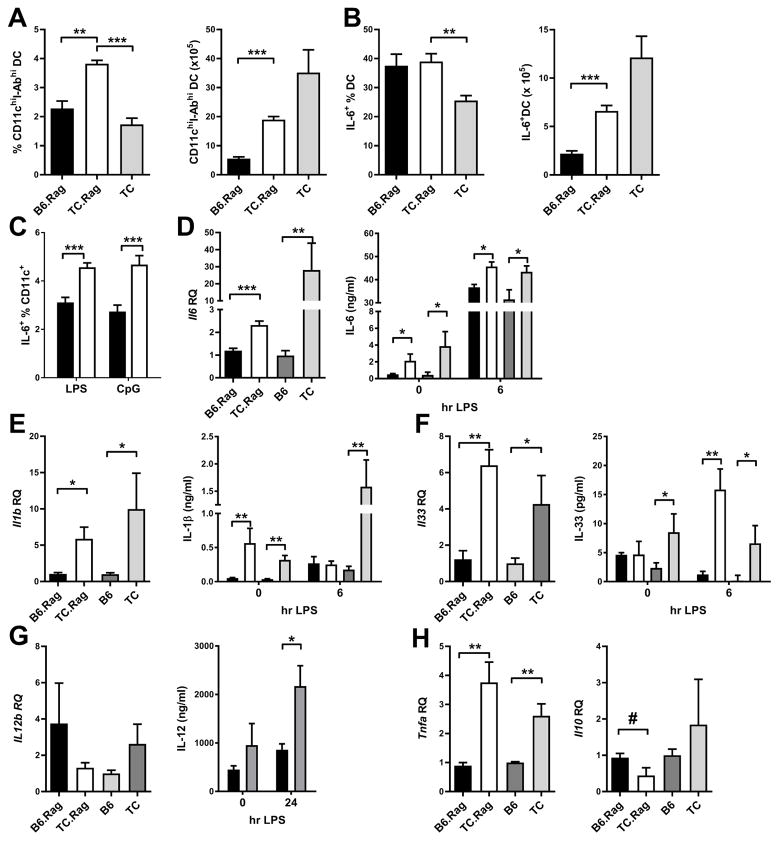
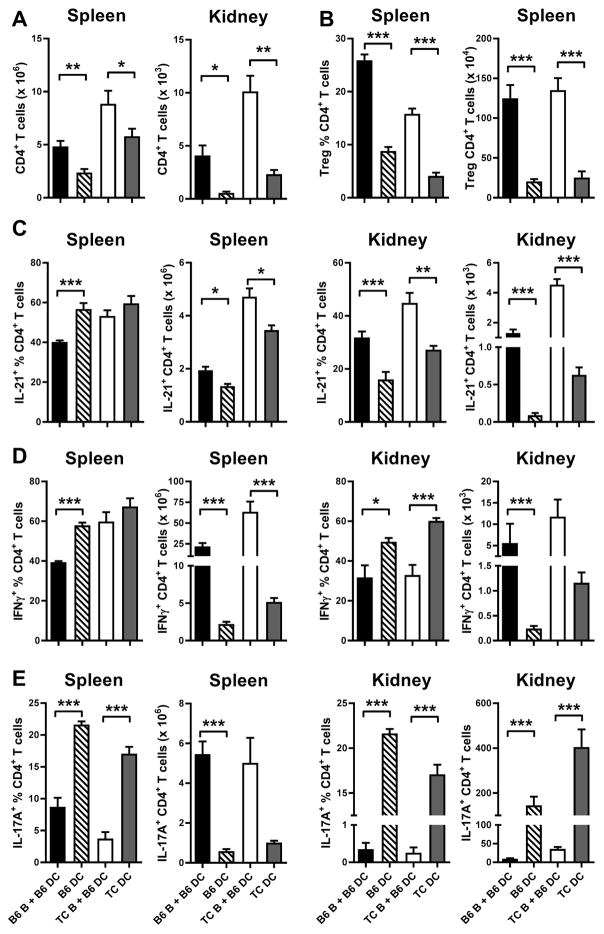
Mouse models of lupus have shown that multiple immune cell types contribute to autoimmune disease. This study sought to investigate the involvement of B cells and dendritic cells in supporting the expansion of inflammatory and regulatory CD4+ T cells that are critical for lupus pathogenesis. We used lupus-prone B6.NZM2410.Sle1.Sle2.Sle3 (TC) and congenic C57BL/6J (B6) control mice to investigate how the genetic predisposition of these two cell types controls the activity of normal B6 T cells. Using an allogeneic in vitro assay, we showed that TC B1-a and conventional B cells expanded Th17 cells significantly more than their B6 counterparts. This expansion was dependent on CD86 and IL-6 expression and mapped to the Sle1 lupus-susceptibility locus. In vivo, TC B cells promoted greater differentiation of CD4+ T cells into Th1 and follicular helper T cells than did B6 B cells, but they limited the expansion of Foxp3 regulatory CD4+ T cells to a greater extent than did B6 B cells. Finally, when normal B6 CD4+ T cells were introduced into Rag1-/- mice, TC myeloid/stromal cells caused their heightened activation, decreased Foxp3 regulatory CD4+ T cell differentiation, and increased renal infiltration of Th1 and Th17 cells in comparison with B6 myeloid/stromal cells. The results show that B cells from lupus mice amplify inflammatory CD4+ T cells in a nonredundant manner with myeloid/stromal cells.


Conflict of interest statement

Conflict of Interest

The authors declare no conflict of interest.

Figures

Figure 1
Figure 1. TC B cells expand Th17 T cells significantly more than B6 B cells in vitro
Phenotypes of bm12 CD4+ T cells cultured in polarizing conditions in the presence of B6 or TC pBa1and sB2 cells for 5 d. A. Th17 polarization: representative FACS plots of CD4+-gated cells stained with IL-17A and Foxp3, and frequency of IL-17A+ CD4+ T cells. B. Treg polarization: Frequency of Foxp3+ CD4+ T cells. C. Th1 polarization: frequency of IFN-γ+ CD4+ T cells. Data represents n = 5–10 mice, expressed as means ± SEM. ** P < 0.01, *** P < 0.001.
Figure 2
Figure 2. Th17 expansion by TC B cells depends on CD86 and IL-6
A. Expression levels of CD44, CD86, CD80 and pBTK in B6 or TC pB1a and sB2 cells. B. Representative FACS plots of bm12 CD4+ gated cells stained with IL-17A and IFNγ that have been cultured with TC sB2 cells alone (-), or with anti-CD44 or anti-CD86 blocking Abs. C. Frequency of IL-17A+ bm12 CD4+ T cells cultured in Th17 polarizing conditions in the presence of B6 or TC sB2 cells with or without IM7 or blocking KM114 anti-CD44 antibody. D. Frequency of IL-17A+ (left) and IFN-γ+ (right) bm12 CD4+ T cells cultured in Th17 or Th1 polarizing conditions in the presence of B6 or TC sB2 cells with or without anti-CD86 Ab. E. IL-6 production by sorted B6 and TC FO and MZ B cells stimulated with CpG. F. Frequency of IL-17A+ bm12 CD4+ T cells cultured in Th17 polarizing conditions in the presence B6 or TC sB2 cells with or without anti-IL-6 Ab or in the absence of IL-6 in the Th17 polarizing media. Data represents n = 9 mice (A), 6 mice (C and D), 3 mice (E and F), expressed as means ± SEM. * P < 0.05, ** P < 0.01, *** P < 0.001.
Figure 3
Figure 3. Sle1 contributes to Th17 expansion by B cells
A–B. Frequency and absolute numbers of IL-17A-producing bm12 CD4+ T cells in Th17 polarizing media co-cultured with sB2 cells from B6, B6.Sle1, B6.Sle2, or TC mice (A) with representative FACS plots shown in (B). C. CD86 and CD44 expression on B6, B6.Sle1, B6.Sle2, and TC sB2 cells. D. IL-6 measured in the supernatants of sB2 cells stimulated with LPS. E. Intracellular IL-6 in sB2 cells stimulated with LPS. Representative FACS plots are shown on the right. Data represents n = 4 – 5 mice, expressed as means ± SEM. Comparisons were made to B6 values, * P < 0.05, ** P < 0.01, *** P < 0.001.
Figure 4
Figure 4. Expanded effector CD4+ T cell populations in TC mice
A. Absolute numbers of CD4+ T cells in the spleen and kidney of B6 and TC mice. B. Frequencies of splenic IFN-γ+ CD4+ T cells. C. Frequencies of IL-17A+ CD4+ T cells in the spleen and absolute numbers in the kidneys. D. Frequencies of splenic IL-21+ CD4+ T cells. Frequencies of splenic (E, CD4+CXCR5hiPD-1hiBCL6+FOXP3) and renal (F, CD45+CD4+CD44hiPSGL-1loPD-1+) Tfh cells with gating strategy shown on the right. Mice were 6–7 months old. Data represents n = 4–7 mice, expressed as means ± SEM. * P < 0.05, ** P < 0.01.
Figure 5
Figure 5. TC sB2 expand the frequencies of IL-21 and IFN-γ-producing CD4+ T cells in vivo
B6 or TC SB2 cells were co-transferred with CD4+ T cells from B6.Il21VFP mice into B6.Rag mice and analysis of recipient mice was conducted one week later. A. Numbers of total CD4+ T cells in the spleen (left) and kidneys (right). B. Representative FACS plots showing IL-21-VFP staining in CD4+ gated cells in spleens and kidneys. Frequencies and numbers of IL-21-VFP+ CD4+ T cells in spleens (C) and kidneys (D). E. Frequencies of splenic Treg cells. F. Frequencies and numbers of splenic IFN-γ+ CD4+ T cells. G. Frequencies of splenic IL-17A+ CD4+ T cells. H. B6.Il21VFP CD4+ T cell phenotypes in B6.Rag transferred with B6, TC or Sle1 sB2 cells and treated with anti-Il-6 neutralizing Ab (+) or isotype control (-). Data represents n = 7 (A–G) mice per group, and 3 for B6, 4 for TC and 1 Sle1 sB2 per pair of B6.Rag recipients (H), expressed as means ± SEM. * P < 0.05, ** P < 0.01, *** P < 0.001.
Figure 6
Figure 6. TC myeloid/stromal cells expand Tfh and IFNγ-producing T cells in vivo.
B6 CD4+ T cells were transferred into B6.Rag or TC.Rag mice and analysis was conducted one week later in recipient mice. A. Numbers of total CD4+ T cells in the spleen and kidneys. Frequencies and numbers of splenic CD69+CD4+ T cells (B), Treg (C, CD4+FOXP3+) and Tfh (D, CD4+CXCR5+PD-1+FOXP3) cells. Frequencies and numbers of IFNγ+ (E–F) and IL-17A+ (G–F) CD4+ T cells in the spleen and kidneys. Data represents n = 5 mice, expressed as means ± SEM. * P < 0.05, ** P < 0.01, *** P < 0.001.
Figure 7
Figure 7. TC DCs present an intrinsic inflammatory phenotype
Frequencies and numbers of total splenic DCs (A) and IL6+ DCs (B) in B6.Rag and TC.Rag mice, as compared to age-matched TC mice. C. IL-6 intracellular staining in splenic DCs from B6.Rag (black) and TC.Rag (white) 24 h after LPS or CpG stimulation. Cytokine gene expression in unstimulated, and secretion in supernatant by BMDCs from the four indicated strain before and after stimulation with LPS: IL-6 (D); IL-1b (E), and IL-33 (F). G. Il12b gene expression and protein expression in supernatants of BMDCs stimulated with LPS for 6 h (qRT-PCR) and 24 h (ELISA). H. Tnfa, and Il10 gene expression in BMDCs, without stimulation for Tnfa, and 6 h after LPS stimulation for Il10. Gene expression was normalized to the B6 mean values. # p < 0.05 one-tailed t test; * p < 0.05, ** p < 0.01, *** p < 0.001. n = 4–6 per strain.
Figure 8
Figure 8. Comparison of the effects of B cells and DCs of CD4+ T cells phenotypes in vivo
CD4+ T cells from B6.Il21VFP mice into B6.Rag or TC.Rag mice with or without B6 or TC B cells. For simplicity, the strain background of the recipient mice is indicated by the strain of origin of the recipient DCs. A. Numbers of total CD4+ T cells in spleens and kidneys. B. Frequencies and numbers of splenic Treg cells. Frequencies and numbers of splenic and kidney IL-21+ CD4+ T cells (C), IFNγ+ CD4+ T cells (D) and IL-17A+ CD4+ T cells (E). Data represents n = 5 mice, expressed as means ± SEM. * P < 0.05, ** P < 0.01, *** P < 0.001.

References

    1. Mariño E, Grey ST. B cells as effectors and regulators of autoimmunity. Autoimmunity. 2012;45:377–387. - PubMed
    1. Vinuesa CG, Sanz I, Cook MC. Dysregulation of germinal centres in autoimmune disease. Nat Rev Immunol. 2009;9:845–857. - PubMed
    1. Craft JE. Follicular helper T cells in immunity and systemic autoimmunity. Nat Rev Rheumatol. 2012;8:337–347. - PMC - PubMed
    1. Blanco P, Ueno H, Schmitt N. T follicular helper (Tfh) cells in lupus: Activation and involvement in SLE pathogenesis. Eur J Immunol. 2016;46:281–290. - PubMed
    1. Sozzani S, Del Prete A, Bosisio D. Dendritic cell recruitment and activation in autoimmunity. J Autoimmun. 2017;85:126–140. - PubMed

Publication types