Comparative Study
. 2018 May 4;8(5):1733-1746.
doi: 10.1534/g3.118.200127.

Comparison of the Relative Potential for Epigenetic and Genetic Variation To Contribute to Trait Stability

Affiliations
Comparative Study

Comparison of the Relative Potential for Epigenetic and Genetic Variation To Contribute to Trait Stability

Emma S T Aller et al. G3 (Bethesda). .

Abstract

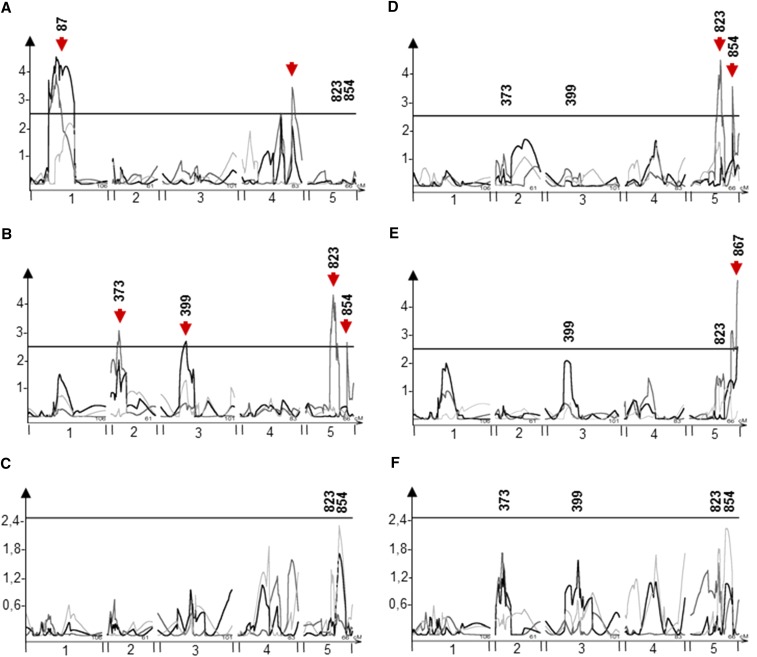
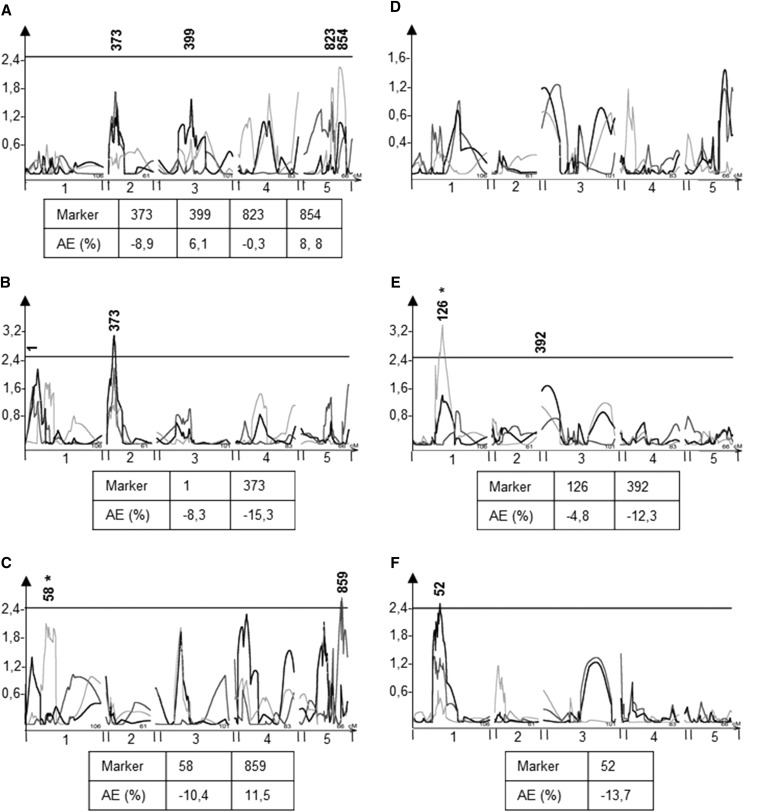
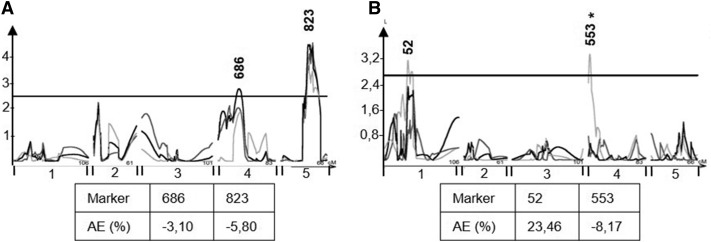
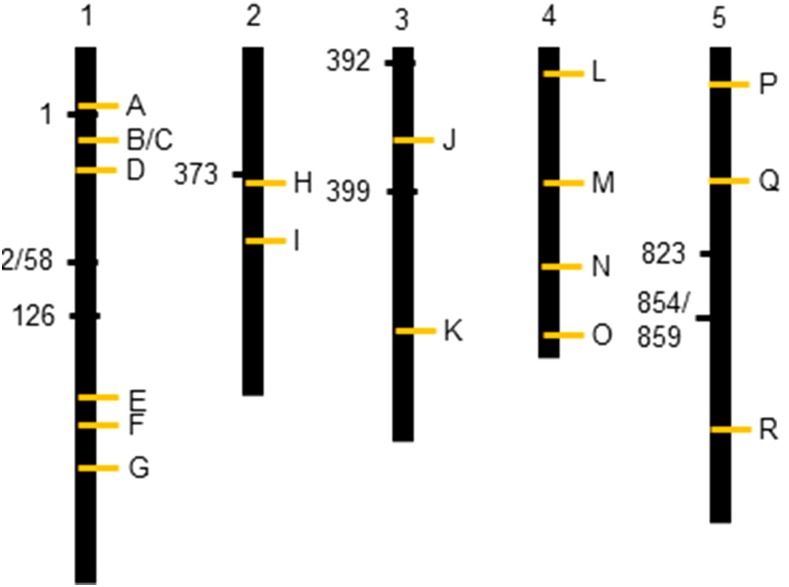
The theoretical ability of epigenetic variation to influence the heritable variation of complex traits is gaining traction in the study of adaptation. This theory posits that epigenetic marks can control adaptive phenotypes but the relative potential of epigenetic variation in comparison to genetic variation in these traits is not presently understood. To compare the potential of epigenetic and genetic variation in adaptive traits, we analyzed the influence of DNA methylation variation on the accumulation of chemical defense compounds glucosinolates from the order Brassicales. Several decades of work on glucosinolates has generated extensive knowledge about their synthesis, regulation, genetic variation and contribution to fitness establishing this pathway as a model pathway for complex adaptive traits. Using high-throughput phenotyping with a randomized block design of ddm1 derived Arabidopsis thaliana epigenetic Recombinant Inbred Lines, we measured the correlation between DNA methylation variation and mean glucosinolate variation and within line stochastic variation. Using this information, we identified epigenetic Quantitative Trait Loci that contained specific Differentially Methylated Regions associated with glucosinolate traits. This showed that variation in DNA methylation correlates both with levels and variance of glucosinolates and flowering time with trait-specific loci. By conducting a meta-analysis comparing the results to different genetically variable populations, we conclude that the influence of DNA methylation variation on these adaptive traits is much lower than the corresponding impact of standing genetic variation. As such, selective pressure on these traits should mainly affect standing genetic variation to lead to adaptation.

Keywords: DNA methylation; Local adaptation; epiQTL mapping; glucosinolates; trait stability.


Figures

Figure 1
Figure 1
Distribution of mean LC glucosinolates among the epiRILs showing the outlier epiRIL 573. A histogram of the mean LC glucosinolate content among the 122 epiRILs is shown in green. The orange bars represent the corresponding histogram for the four WT lines.
Figure 2
Figure 2
Distribution of mean and within line (CV) glucosinolate (GLS) traits among the epiRILs. Green bars show the distribution of the mean traits among the epiRILs, blue bars show the histogram of the within line variation among the epiRILs as measured by CV. Orange bars represent the distribution of the corresponding four WT lines for the specific trait shown. A) LSmean SC glucosinolate content, B) LSmean LC glucosinolate content, C) LSmean Indolic glucosinolate content, D) Within line CV for SC glucosinolates, E) Within line CV for LC glucosinolates, F) Within line CV for Indolic glucosinolates.
Figure 3
Figure 3
Within line distribution of flowering time mean and CV. Green bars show the distribution of the mean flowering time among the epiRILs, blue bars show the histogram of the within line variation in flowering time among the epiRILs as measured by CV. Orange bars represent the distribution of the corresponding four WT lines for the specific trait shown. A) Mean Flowering time, B) Within line CV for Flowering time.
Figure 4
Figure 4
Meta-analysis of population level variation between epiRILs and genetic populations. The variation within the population (population CV) for mean glucosinolate traits is shown for epiRILs or genetic RILs or genetic association mapping populations are shown. The SC, LC and indolic traits are shown on the x-axis. Error bars for each glucosinolate mark the 99th percentile confidence interval for the genetically variable populations (RILs and accessions).
Figure 5
Figure 5
EpiQTL mapping of SC glucosinolate means. Plots show composite interval mapping results and significance estimated from 1000 permutations. The x-axis shows the genome by chromosome and the y-axis shows the LOD score. The significance thresholds are plotted for each trait and significant QTL are re marked with red arrows. The light gray line shows the QTL map using the means from experiment 1, dark gray shows experiment 2, and black lines represent the pooled data from experiment 1 and 2. Marker names show the position of significant makers after using a linear model to assess loci. EpiQTLs not assigned a marker were rejected in the subsequent ANOVA. Glucosinolate abbreviations are shown in Table S1. Analyzed SC glucosinolates are A) 3MTP, B) 3MSP, C) 4MTB, D) 4MSB, E) 5MSP, F) Pooled SC glucosinolates.
Figure 6
Figure 6
EpiQTL mapping of glucosinolate mean and CV. Plots show composite interval mapping results and significance estimated from 1000 permutations. The x-axis shows the genome by chromosome and y-axis shows the LOD score. The significance thresholds are plotted for each trait and significant QTL are re marked with red arrows. The light gray line shows the QTL map using the means from experiment 1, dark gray shows experiment 2, and black lines represent the pooled data from experiment 1 and 2. Marker names show the position of significant makers after using a linear model to assess loci. EpiQTLs not assigned a marker were rejected in the subsequent ANOVA. An asterisk after a marker shows that the marker was not significant in both experiments. Beneath plots are shown the additive effect of markers, i.e., the percentage phenotypic change when the marker is ddm1 within the epiRIL lines compared to WT. A) Mean SC glucosinolate content, B) Mean LC glucosinolate content, C) Mean Indolic glucosinolate content, D) Within line CV for SC glucosinolates, E) Within line CV for LC glucosinolates, F) Within line CV for Indolic glucosinolates.
Figure 7
Figure 7
EpiQTL mapping of flowering time mean and CV. Plots show composite interval mapping results and significance estimated from 1000 permutations. The x-axis shows the genome by chromosome and y-axis shows the LOD score. The significance thresholds are plotted for each trait and significant QTL are re marked with red arrows. The light gray line shows the QTL map using the means from experiment 1, dark gray shows experiment 2, and black lines represent the pooled data from experiment 1 and 2. Marker names show the position of significant makers after using a linear model to assess loci. An asterisk after a marker shows that the marker was not significant in both experiments. Beneath plots are shown the additive effect of markers, i.e., the percentage phenotypic change when the marker is ddm1 within the epiRIL lines compared to WT. EpiQTLs not assigned a marker were rejected in the subsequent ANOVA. A) Mean Flowering time, B) Within line CV for Flowering time.
Figure 8
Figure 8
Genomic position of significant epiQTL markers and glucosinolate genes. The markers associated with significant epiQTL are shown to the left of each chromsome. Letters denote glucosinolate genes: A, AT1G12140 FMO GS-OX5. B, AT1G16410 CYP79F1 and AT1G16400 CYP79F2. C, AT1G18590 SOT17. D, AT1G24100 UGT74B1. E, AT1G62540 FMO GS-OX2 and AT1G62560 FMO GS-OS3 and AT1G62570 FMO GS-OX4. F, AT1G65860 FMO GS-OX1. G, AT1G74100 SOT16 and AT1G74090 SOT18. H, AT2G20610 SUR1. I, AT2G31790 UGT74C1. J, AT3G19710 BCAT4. K, AT3G49680 BCAT3. L, AT4G03060 AOP2 and AT4G03050 AOP3. M, AT4G13770 CYP83A1. N: AT4G30530 GGP1. O, AT4G39950 CYP79B2 and AT2G22330 CYP79B3. P, AT5G07690 MYB29 and AT5G07700 MYB76. Q, AT5G23010 MAM1 and AT5G23020 MAM3. R, AT5G61420 MYB28.

References

    1. Ansel J., Bottin H., Rodriguez-Beltran C., Damon C., Nagarajan M., et al. , 2008. Cell-to-cell stochastic variation in gene expression is a complex genetic trait. PLoS Genet. 4(4): e1000049 10.1371/journal.pgen.1000049 - DOI - PMC - PubMed
    1. Atwell S., Huang Y. S., Vilhjálmsson B. J., Willems G., Li Y., et al. , 2010. Genome-wide association study of 107 phenotypes in a common set of Arabidopsis thaliana inbred lines. Nature 465(7298): 627–631. 10.1038/nature08800 - DOI - PMC - PubMed
    1. Brachi B., Meyer C. G., Villoutreix R., Platt A., Morton T. C., et al. , 2015. Coselected genes determine adaptive variation in herbivore resistance throughout the native range of Arabidopsis thaliana. Proc. Natl. Acad. Sci. USA 112(13): 4032–4037. 10.1073/pnas.1421416112 - DOI - PMC - PubMed
    1. Burggren W, 2016. Epigenetic inheritance and its role in evolutionary biology: re-evaluation and new perspectives. Biology (Basel) 4: 24 10.3390/biology5020024 - DOI - PMC - PubMed
    1. Burow M., Atwell S., Francisco M., Kerwin R. E., Halkier B. A., et al. , 2015. The Glucosinolate Biosynthetic Gene AOP2 Mediates Feed-back Regulation of Jasmonic Acid Signaling in Arabidopsis. Mol. Plant 8(8): 1201–1212. 10.1016/j.molp.2015.03.001 - DOI - PubMed

Publication types