. 2018 Jun 4;217(6):2047-2058.
doi: 10.1083/jcb.201711151. Epub 2018 Mar 21.

EB1 binding restricts STIM1 translocation to ER-PM junctions and regulates store-operated Ca2+ entry

Affiliations

EB1 binding restricts STIM1 translocation to ER-PM junctions and regulates store-operated Ca2+ entry

Chi-Lun Chang et al. J Cell Biol. .

Abstract

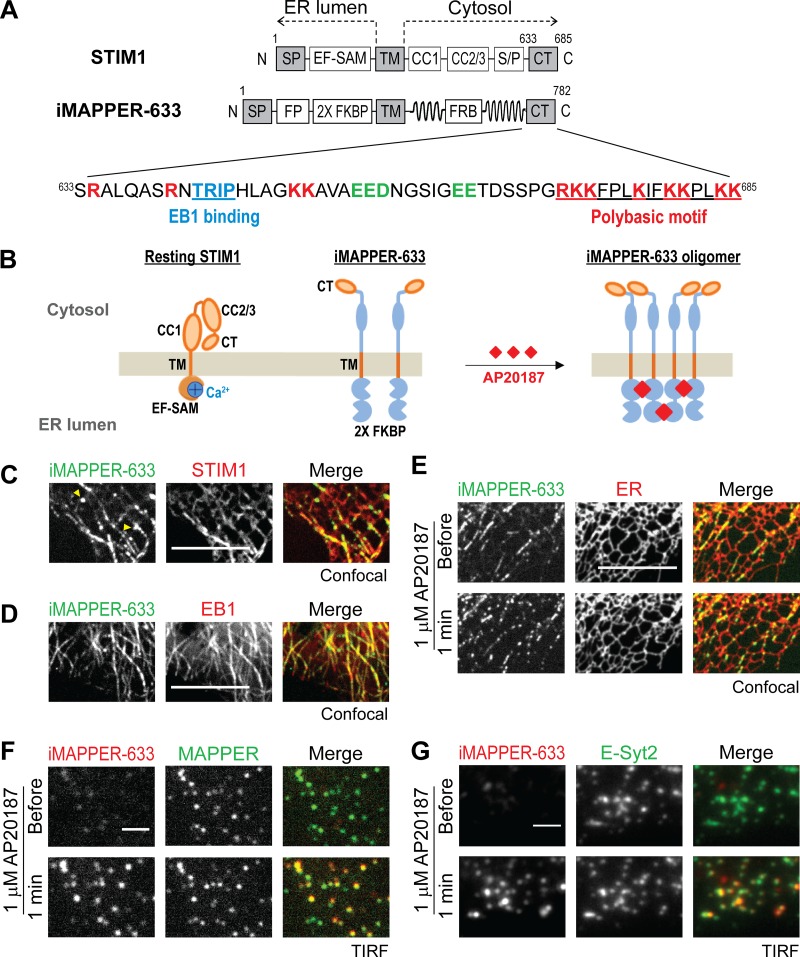
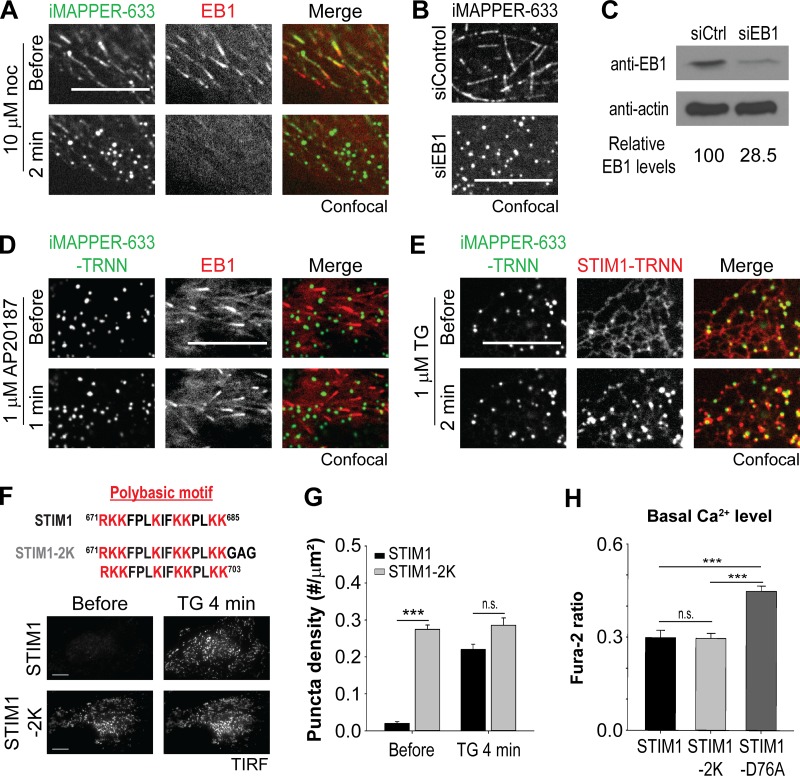
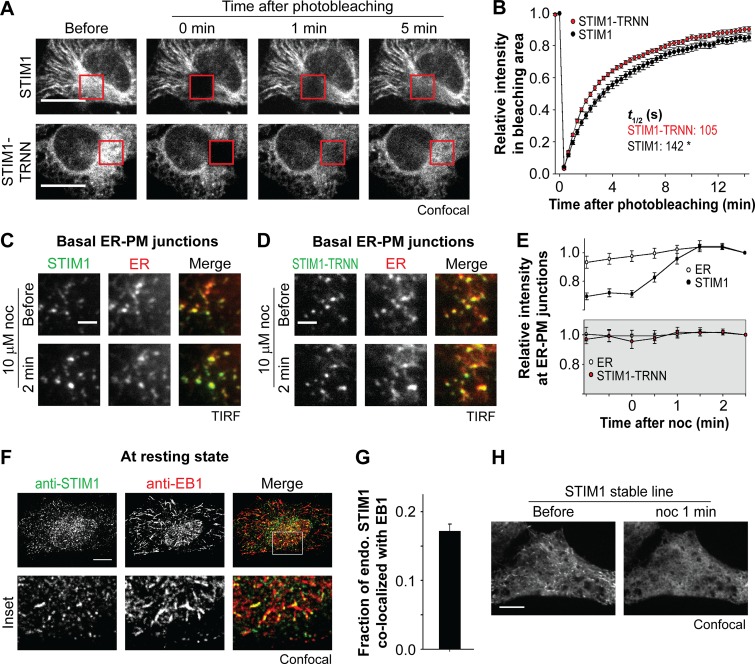
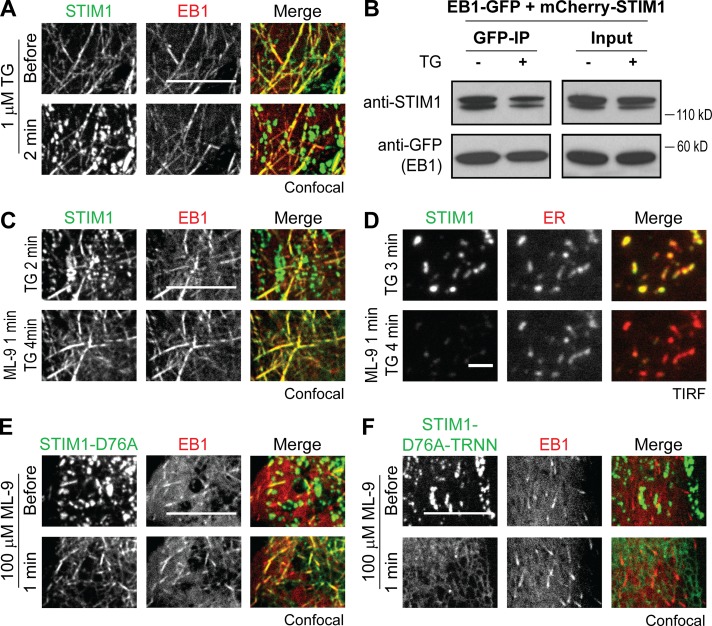
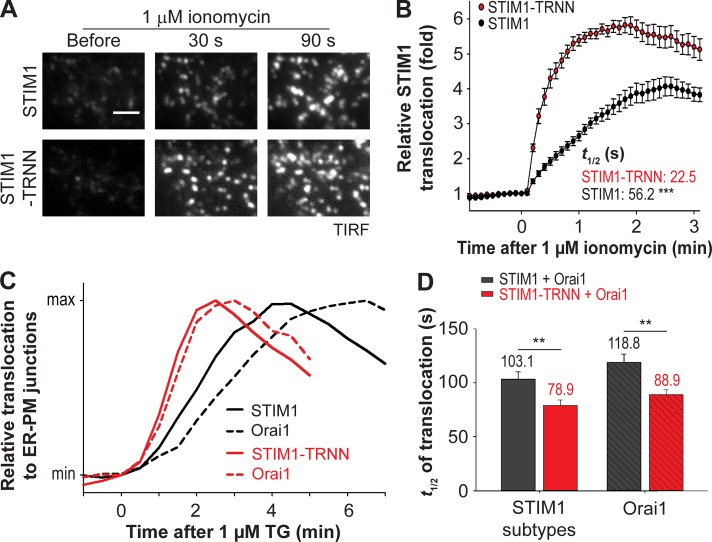
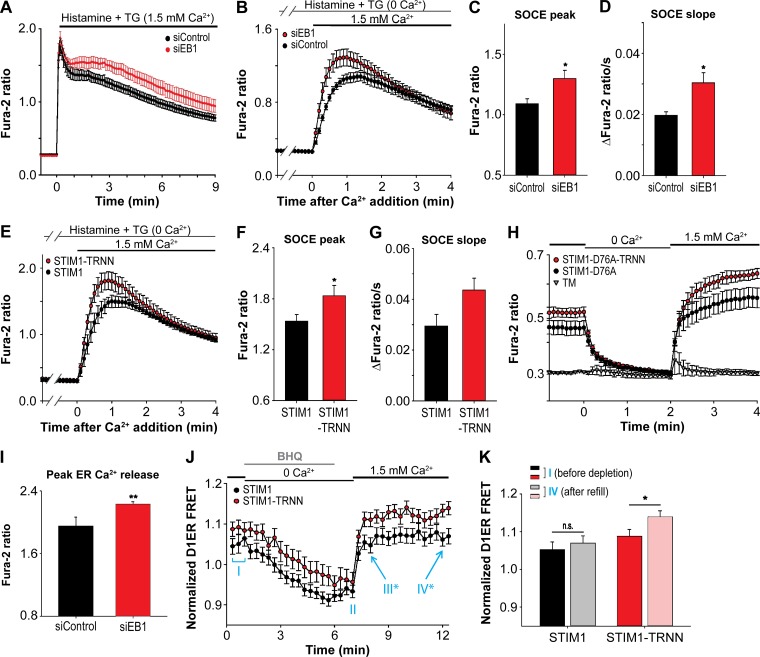
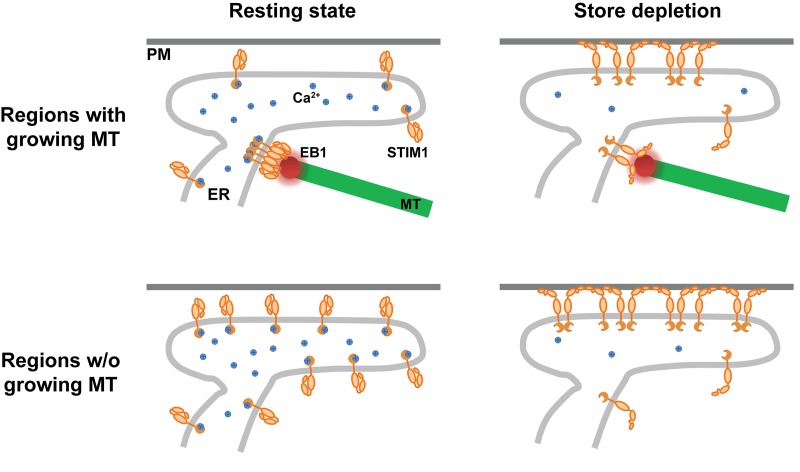
The endoplasmic reticulum (ER) Ca2+ sensor STIM1 forms oligomers and translocates to ER-plasma membrane (PM) junctions to activate store-operated Ca2+ entry (SOCE) after ER Ca2+ depletion. STIM1 also interacts with EB1 and dynamically tracks microtubule (MT) plus ends. Nevertheless, the role of STIM1-EB1 interaction in regulating SOCE remains unresolved. Using live-cell imaging combined with a synthetic construct approach, we found that EB1 binding constitutes a trapping mechanism restricting STIM1 targeting to ER-PM junctions. We further showed that STIM1 oligomers retain EB1 binding ability in ER Ca2+-depleted cells. By trapping STIM1 molecules at dynamic contacts between the ER and MT plus ends, EB1 binding delayed STIM1 translocation to ER-PM junctions during ER Ca2+ depletion and prevented excess SOCE and ER Ca2+ overload. Our study suggests that STIM1-EB1 interaction shapes the kinetics and amplitude of local SOCE in cellular regions with growing MTs and contributes to spatiotemporal regulation of Ca2+ signaling crucial for cellular functions and homeostasis.


Figures

Figure 1.
Figure 1.
iMAPPER-633: A synthetic construct for dissecting targeting mechanisms of STIM1. (A) Diagrams of STIM1 and iMAPPER-633. Amino acid number and domains are indicated. EF-SAM, EF hand and sterile α motif; FRB, FKBP–rapamycin binding domain. Identical domains between STIM1 and iMAPPER-633 are in gray. The amino acid sequences of STIM1 CT are displayed. Core EB1 binding motifs are labeled in blue, positively charged residue are in red, and negatively charged residues are in green. (B) Schematic diagram depicting resting STIM1 and iMAPPER-633 and oligomerized iMAPPER-633 after AP20187 treatment. Domains are indicated as in A. (C) Localization of YFP–iMAPPER-633 in HeLa cells coexpressing mCherry-STIM1, monitored by confocal microscopy. Yellow arrowheads indicate iMAPPER-633 puncta without STIM1 colocalization, possibly formed because of loss of EB1 binding during MT catastrophe. (D) Localization of YFP–iMAPPER-633 in HeLa cells coexpressing EB1-mCherry, monitored by confocal microscopy. (E) YFP–iMAPPER-633 displays punctate localization after 1 µM AP20187 treatment, monitored by confocal microscopy in HeLa cells cotransfected with mCherry-ER. (F) Translocation of mCherry–iMAPPER-633 to ER–PM junctions after 1 µM AP20187 treatment, monitored by TIRF microscopy in HeLa cells cotransfected with GFP-MAPPER. (G) Translocation of mCherry–iMAPPER-633 to ER–PM junctions after 1 µM AP20187 treatment, monitored by TIRF microscopy in HeLa cells cotransfected with GFP–E-Syt2. Bars: (C–E) 10 µm; (F and G) 2 µm.
Figure 2.
Figure 2.
EB1 binding prevents the PB from mediating PM targeting. (A) Translocation of YFP–iMAPPER-633 to ER–PM junctions after 10 µM nocodazole (noc) treatment, monitored by confocal microscopy in HeLa cells cotransfected with EB1-mCherry. (B) Subcellular localizations of YFP–iMAPPER-633, monitored by confocal microscopy in HeLa cells transfected with siControl or siEB1. (C) EB1 protein levels detected by Western blotting using anti-EB1 antibody in HeLa cells transfected with siControl (siCtrl) or siEB1. The intensity of bands was measured by ImageJ. Relative EB1 levels are indicated. (D) YFP–iMAPPER-633–TRNN distributes to ER–PM junctions in the absence or presence of AP20187 in HeLa cells, monitored by confocal microscopy. (E) Translocation of mCherry-STIM1-TRNN to ER–PM junctions labeled by YFP–iMAPPER-633–TRNN after 1 µM TG treatment in HeLa cells, monitored by confocal microscopy. (F) Localization of YFP-STIM1 and YFP-STIM1-2K with two PB in tandem in the CT in the absence or presence of 1 µM TG in HeLa cells, monitored by TIRF microscopy. Bars, 10 µm. (G) Quantification of the puncta density of YFP-STIM1 and YFP-STIM1-2K as described in F. Means ± SEM are shown (9–13 cells from two independent experiments). (H) Basal cytosolic Ca2+ levels, monitored by Fura-2 ratio in HeLa cells transfected with mCherry-STIM1, mCherry-STIM1-2K, or mCherry-STIM1-D76A. Means ± SD are shown (three independent experiments). ***, P < 0.001.
Figure 3.
Figure 3.
EB1 binding constitutes a trapping mechanism limiting STIM1 localization at ER–PM junctions. (A) Fluorescence recovery of YFP-STIM1 and YFP-STIM1-TRNN after photobleaching (red square boxes) in HeLa cells, monitored by confocal microscopy. (B) Relative intensity of YFP-STIM1 and YFP-STIM1-TRNN in the bleached areas as described in A. 19–20 cells from three independent experiments. Mean times to the half recovery (t1/2) are indicated. *, P < 0.05. (C and D) Changes in intensity of YFP-STIM1 (C) and YFP-STIM1-TRNN (D) at ER–PM junctions after 10 µM nocodazole (noc) treatment, monitored by TIRF microscopy in HeLa cells cotransfected with mCherry-ER. (E) Relative changes in intensity of STIM1 subtypes and mCherry-ER at ER–PM junctions derived from relative single puncta intensity as described in C and D. Intensity at the end time point is defined as 1. 13–14 cells from three to four independent experiments. (F) Localization of endogenous STIM1 and EB1 at resting state, visualized by immunostaining using confocal microscopy. (G) Fraction of STIM1 overlapping with EB1 calculated from quantification of endogenous (endo.) STIM1 and EB1 colocalization by immunostaining as described in F. Means ± SEM are shown. 29 cells from two independent experiments. (H) Changes in localization of YFP-STIM1 after 10 µM nocodazole treatment, monitored by confocal microscopy in HeLa cells stably expressing YFP-STIM1 at a low level. Bars: (A, F, and H) 10 µm; (C and D) 2 µm.
Figure 4.
Figure 4.
Activated STIM1 retains EB1 binding ability in ER Ca2+-depleted cells. (A) Localization of YFP-STIM1 and EB1-mCherry in HeLa cells during the resting state and after 1 µM TG treatment, monitored by confocal microscopy. (B) IP of EB1-GFP with mCherry-STIM1 after 1 µM TG treatment in HeLa cells. Protein levels of EB1-GFP and mCherry-STIM1 in total cell lysates (Input) and IP were assessed by Western blotting using antibodies against GFP and STIM1. (C) Colocalization of YFP-STIM1 and EB1-mCherry in HeLa cells after 100 µM ML-9 treatment during ER Ca2+ depletion by 1 µM TG, monitored by confocal microscopy. (D) Disruption of TG-induced YFP-STIM1 accumulation at ER–PM junctions labeled by mCherry-ER in HeLa cells after 100 µM ML-9 treatment, monitored by TIRF microscopy. (E) Colocalization of YFP-STIM1-D76A and EB1-mCherry in HeLa cells after 100 µM ML-9 treatment, monitored by confocal microscopy. (F) YFP-STIM1-D76A-TRNN displayed ER localization without colocalizing with EB1-mCherry in HeLa cells after 100 µM ML-9 treatment, monitored by confocal microscopy. Bars: (A, C, E, and F) 10 µm; (D) 2 µm.
Figure 5.
Figure 5.
EB1 binding impedes STIM1 translocation to ER–PM junctions and Orai1 recruitment during ER Ca2+ depletion. (A) Translocation of YFP-STIM1 and YFP-STIM1-TRNN to ER–PM junctions after 1 µM ionomycin treatment in HeLa cells, monitored by TIRF microscopy. Bar, 2 µm. (B) Relative translocation to ER–PM junctions of YFP-STIM1 and YFP-STIM1-TRNN as described in A. 14–15 cells from three independent experiments. Mean times to half-maximal translocation (t1/2) are indicated. (C) Relative translocation to ER–PM junctions of YFP-STIM1 subtypes and corresponding Orai1-mCherry after 1 µM TG treatment in HeLa cells, monitored by TIRF microscopy. Black, YFP-STIM1 coexpressed with Orai1-mCherry; red, STIM1-TRNN coexpressed with Orai1-mCherry. Mean traces are shown (15–23 cells from three to four independent experiments). (D) Time to the half-maximal translocation (t1/2) of YFP-STIM1 subtypes and Orai1-mCherry as described in C. Means ± SEM are shown. **, P < 0.01; ***, P < 0.001.
Figure 6.
Figure 6.
Disruption of STIM1–EB1 interaction facilitated SOCE and resulted in ER Ca2+ store overload. (A) Relative changes in cytosolic Ca2+ concentration after 100 µM histamine and 1 µM TG treatment, monitored by Fura-2 ratio in HeLa cells transfected with siControl or siEB1. Four independent experiments. (B) SOCE triggered by 100 µM histamine and 1 µM TG treatment, monitored by Fura-2 ratio in HeLa cells transfected with siControl or siEB1. Three independent experiments. (C) Peak of SOCE in HeLa cells treated with siControl or siEB1 as described in B. Three independent experiments. (D) Slope of SOCE in HeLa cells treated with siControl or siEB1 as described in B. Three independent experiments. (E) SOCE triggered by 100 µM histamine and 1 µM TG treatment, monitored by Fura-2 ratio in HeLa cells transfected with YFP-STIM1 or YFP-STIM1-TRNN. Three independent experiments. (F) Peak of SOCE in HeLa cells transfected with YFP-STIM1 and YFP-STIM1-TRNN as described in E. Three independent experiments. (G) Slope of SOCE in HeLa cells transfected with YFP-STIM1 and YFP-STIM1-TRNN as described in E. Three independent experiments. (H) Relative changes in cytosolic Ca2+ concentration in response to depletion and readdition of extracellular Ca2+, monitored by Fura-2 ratio in HeLa cells transfected with YFP-TM, YFP-STIM1-D76A, or YFP-STIM1-D76A-TRNN. Three to four independent experiments. (I) Peak ER Ca2+ release by 1 µM ionomycin treatment in the absence of extracellular Ca2+, monitored by Fura-2 ratio in HeLa cells transfected with siControl or siEB1. Three independent experiments. (J) Relative ER Ca2+ levels in the resting state (phase I), after 5 µM BHQ treatment (phase II), and after BHQ washout (phase III and IV), monitored by D1ER in HeLa cells transfected with mCherry-STIM1 or mCherry-STIM1-TRNN. 16–26 cells from three independent experiments. *, P < 0.05 between STIM1 and STIM1-TRNN. (K) Relative ER Ca2+ levels in phase I and IV as described in J, monitored by D1ER in HeLa cells transfected with mCherry-STIM1 or mCherry-STIM1-TRNN. Means ± SEM are shown. *, P < 0.05; **, P < 0.01.
Figure 7.
Figure 7.
Model. STIM1–EB1 interaction regulates STIM1 translocation to ER–PM junctions.

References

    1. Baba Y., Hayashi K., Fujii Y., Mizushima A., Watarai H., Wakamori M., Numaga T., Mori Y., Iino M., Hikida M., and Kurosaki T.. 2006. Coupling of STIM1 to store-operated Ca2+ entry through its constitutive and inducible movement in the endoplasmic reticulum. Proc. Natl. Acad. Sci. USA. 103:16704–16709. 10.1073/pnas.0608358103 - DOI - PMC - PubMed
    1. Bakowski D., Glitsch M.D., and Parekh A.B.. 2001. An examination of the secretion-like coupling model for the activation of the Ca2+ release-activated Ca2+ current I (CRAC) in RBL-1 cells. J. Physiol. 532:55–71. 10.1111/j.1469-7793.2001.0055g.x - DOI - PMC - PubMed
    1. Berridge M.J., Lipp P., and Bootman M.D.. 2000. The versatility and universality of calcium signalling. Nat. Rev. Mol. Cell Biol. 1:11–21. 10.1038/35036035 - DOI - PubMed
    1. Casas-Rua V., Tomas-Martin P., Lopez-Guerrero A.M., Alvarez I.S., Pozo-Guisado E., and Martin-Romero F.J.. 2015. STIM1 phosphorylation triggered by epidermal growth factor mediates cell migration. Biochim. Biophys. Acta. 1853:233–243. 10.1016/j.bbamcr.2014.10.027 - DOI - PubMed
    1. Chang C.L., and Liou J.. 2016. Homeostatic regulation of the PI(4,5)P2-Ca(2+) signaling system at ER-PM junctions. Biochim. Biophys. Acta. 1861(8, 8 Pt B):862–873. 10.1016/j.bbalip.2016.02.015 - DOI - PMC - PubMed

Publication types