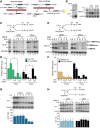
Balance between MAT2A intron detention and splicing is determined cotranscriptionally
- PMID: 29563249
- PMCID: PMC5959247
- DOI: 10.1261/rna.064899.117
Balance between MAT2A intron detention and splicing is determined cotranscriptionally
Abstract
Transcriptome analysis of human cells has revealed that intron retention controls the expression of a large number of genes with diverse cellular functions. Detained introns (DI) constitute a subgroup of transcripts with retained introns that are not exported to the cytoplasm but instead remain in the nucleus. Previous studies reported that the splicing of DIs in the CLK1 transcript is post-transcriptionally induced to produce mature mRNA in the absence of new transcription. Thus, CLK1-DI serves as a precursor or "reservoir" for the CLK1 mRNA. However, whether this is a universal mechanism for gene regulation by intron detention remains unknown. The MAT2A gene encodes S-adenosylmethionine (SAM) synthetase and it contains a DI that is regulated in response to intracellular SAM levels. We used three independent assays to assess the precursor-product relationship between MAT2A-DI and MAT2A mRNA. In contrast to CLK1-DI, these data support a model in which the MAT2A-DI transcript is not a precursor to mRNA but is instead a "dead-end" RNA fated for nuclear decay. Additionally, we show that in SAM-deprived conditions the cotranscriptional splicing of MAT2A detained introns increases. We conclude that polyadenylated RNAs with DIs can have at least two distinct fates. They can serve as nuclear reservoirs of pre-mRNAs available for rapid induction by the cell, or they constitute dead-end RNAs that are degraded in the nucleus.
Keywords: MAT2A; S-adenosylmethionine; intron detention; intron retention; splicing.
© 2018 Pendleton et al.; Published by Cold Spring Harbor Laboratory Press for the RNA Society.
Figures


Similar articles
-
SAM homeostasis is regulated by CFIm-mediated splicing of MAT2A.Elife. 2021 May 5;10:e64930. doi: 10.7554/eLife.64930. Elife. 2021. PMID: 33949310 Free PMC article.
-
The U6 snRNA m6A Methyltransferase METTL16 Regulates SAM Synthetase Intron Retention.Cell. 2017 May 18;169(5):824-835.e14. doi: 10.1016/j.cell.2017.05.003. Cell. 2017. PMID: 28525753 Free PMC article.
-
Functional analysis of 3'-UTR hairpins supports a two-tiered model for posttranscriptional regulation of MAT2A by METTL16.RNA. 2023 Nov;29(11):1725-1737. doi: 10.1261/rna.079695.123. Epub 2023 Aug 11. RNA. 2023. PMID: 37567786 Free PMC article.
-
Nuclear mechanisms of gene expression control: pre-mRNA splicing as a life or death decision.Curr Opin Genet Dev. 2021 Apr;67:67-76. doi: 10.1016/j.gde.2020.11.002. Epub 2020 Dec 5. Curr Opin Genet Dev. 2021. PMID: 33291060 Free PMC article. Review.
-
Pleiotropic effects of methionine adenosyltransferases deregulation as determinants of liver cancer progression and prognosis.J Hepatol. 2013 Oct;59(4):830-41. doi: 10.1016/j.jhep.2013.04.031. Epub 2013 May 7. J Hepatol. 2013. PMID: 23665184 Review.
Cited by
-
The catalytic-dead Pcif1 regulates gene expression and fertility in Drosophila.RNA. 2023 May;29(5):609-619. doi: 10.1261/rna.079192.122. Epub 2023 Feb 8. RNA. 2023. PMID: 36754578 Free PMC article.
-
Let It Go: HIV-1 cis-Acting Repressive Sequences.J Virol. 2021 Jul 12;95(15):e0034221. doi: 10.1128/JVI.00342-21. Epub 2021 Jul 12. J Virol. 2021. PMID: 33980600 Free PMC article. Review.
-
Structure-Based Evolution of Low Nanomolar O-GlcNAc Transferase Inhibitors.J Am Chem Soc. 2018 Oct 24;140(42):13542-13545. doi: 10.1021/jacs.8b07328. Epub 2018 Oct 4. J Am Chem Soc. 2018. PMID: 30285435 Free PMC article.
-
Do not panic: An intron-centric guide to alternative splicing.Plant Cell. 2023 May 29;35(6):1752-1761. doi: 10.1093/plcell/koad009. Plant Cell. 2023. PMID: 36648241 Free PMC article. Review.
-
Predictive models of subcellular localization of long RNAs.RNA. 2019 May;25(5):557-572. doi: 10.1261/rna.068288.118. Epub 2019 Feb 11. RNA. 2019. PMID: 30745363 Free PMC article.
References
-
- Braun CJ, Stanciu M, Boutz PL, Patterson JC, Calligaris D, Higuchi F, Neupane R, Fenoglio S, Cahill DP, Wakimoto H, et al. 2017. Coordinated splicing of regulatory detained introns within oncogenic transcripts creates an exploitable vulnerability in malignant glioma. Cancer Cell 32: 411–426.e11. - PMC - PubMed
Publication types
MeSH terms
Substances
Grants and funding
LinkOut - more resources
Full Text Sources
Other Literature Sources
Miscellaneous
