. 2018 Mar 22;3(6):e96244.
doi: 10.1172/jci.insight.96244.

Deficiency of immunoregulatory indoleamine 2,3-dioxygenase 1in juvenile diabetes

Affiliations

Deficiency of immunoregulatory indoleamine 2,3-dioxygenase 1in juvenile diabetes

Ciriana Orabona et al. JCI Insight. .

Abstract

A defect in indoleamine 2,3-dioxygenase 1 (IDO1), which is responsible for immunoregulatory tryptophan catabolism, impairs development of immune tolerance to autoantigens in NOD mice, a model for human autoimmune type 1 diabetes (T1D). Whether IDO1 function is also defective in T1D is still unknown. We investigated IDO1 function in sera and peripheral blood mononuclear cells (PBMCs) from children with T1D and matched controls. These children were further included in a discovery study to identify SNPs in IDO1 that might modify the risk of T1D. T1D in children was characterized by a remarkable defect in IDO1 function. A common haplotype, associated with dysfunctional IDO1, increased the risk of developing T1D in the discovery and also confirmation studies. In T1D patients sharing such a common IDO1 haplotype, incubation of PBMCs in vitro with tocilizumab (TCZ) - an IL-6 receptor blocker - would, however, rescue IDO1 activity. In an experimental setting with diabetic NOD mice, TCZ was found to restore normoglycemia via IDO1-dependent mechanisms. Thus, functional SNPs of IDO1 are associated with defective tryptophan catabolism in human T1D, and maneuvers aimed at restoring IDO1 function would be therapeutically effective in at least a subgroup of T1D pediatric patients.

Keywords: Amino acid metabolism; Autoimmunity; Diabetes; Immunology; Immunotherapy.


Conflict of interest statement

Conflict of interest: The authors have declared that no conflict of interest exists.

Figures

Figure 1
Figure 1. Tryptophan catabolism is reduced in PBMCs of pediatric patients with T1D.
(A) Real-time PCR analysis of IDO1 transcripts in PBMCs, either unstimulated (0) or stimulated for 48 hours with IFN-γ at 100 or 1,000 U/ml, normalized to the expression of ACTB (encoding β-actin), and presented relative to results in untreated cells (dotted line, 1-fold; n =33–16, Ctrl; n = 97–18, T1D). (B) Immunoblot analysis of IDO1 and β-tubulin in lysates of peripheral blood mononuclear cells (PBMCs), either unstimulated (0) or stimulated for 48 hours with IFN-γ at 100 or 1,000 U/ml, from 3 representative control subjects and T1D patients (indicated at the right side). (C) IDO1/β-tubulin ratios of scanning densitometry data obtained from immunoblot analyses as in B (all groups, n = 27). (D) Kyn levels in supernatants of PBMCs treated as in A from control subjects (n = 74, 67, and 38 for 0, 100, and 1,000 U/ml IFN-γ, respectively) or T1D patients (n = 169, 145, and 55 for 0, 100, and 1,000 U/ml IFN-γ, respectively). (E) Linear regression analysis of l-kynurenine (Kyn; μM) versus IDO1/β-tubulin in T1D PBMCs unstimulated or stimulated as in A (r2 = 0.7099 and P < 0.0001; n = 27). Ctrl, nondiabetic subjects. T1D, diabetic patients. Data (mean ± SEM) in A and C–E are the result of 3 independent measurements performed in triplicate. Data in A and C were analyzed by 2-way ANOVA followed by post hoc Bonferroni’s test. The Kruskal-Wallis with post hoc Dunn’s test was used for the analysis of E. **P < 0.01; ***P < 0.001.
Figure 2
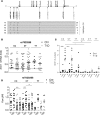
Figure 2. Defective tryptophan catabolism in T1D patients is associated with a specific IDO1 genotype.
(A) Human IDO1 gene structure and SNP localization. The tag SNPs are identified in bold. Exons and untranslated regions are depicted in dark and light gray, respectively. Genotype frequencies for the T1D patients and healthy controls were used to phase haplotype configuration. Rare haplotypes (frequency <2%) are not represented. (B) IDO1 mRNA (measured as in Figure 1A) in peripheral blood mononuclear cells (PBMCs) stratified according to rs7820268 genotypes (n = 8–36). (C) IDO1/β-tubulin protein ratios of scanning densitometry data obtained from immunoblot analyses as in Figure 1, B and C, from PBMCs stratified as in B (all groups, n = 5–11). (D) l-kynurenine (Kyn) production by PBMCs according to rs7820268 genotypes (n = 7–42). Ctrl, nondiabetic subjects. T1D, diabetic patients. Data (mean ± SEM) in panels BD are the results of 3 independent measurements performed in triplicates. Data in panels BD were analyzed by 2-way ANOVA, followed by post hoc Bonferroni’s test.*P < 0.05; **P < 0.01, ***P < 0.001.
Figure 3
Figure 3. Peripheral blood mononuclear cells (PBMCs) from T1D patients express abnormal levels of SOCS3 and IL-6R.
(A) Absolute expression levels of SOCS3, IL6, and IL6R transcripts in untreated PBMCs normalized to ACTB expression (n = 26–97). (B) Real-time PCR analysis of SOCS3, IL6, and IL6R transcripts in PBMCs treated as in Figure 1A. Data were normalized to expression of ACTB (encoding β-actin) and presented relative to results in untreated cells (dotted line, 1-fold; n = 23–98). (C) Linear regression analyses of SOCS3, IL6, and IL6R expression vs. disease duration in T1D PBMCs stimulated with IFN-γ at 1,000 U/ml (n = 22). (D) IL-6 protein levels measured by ELISA in culture supernatants of PBMCs from control or T1D subjects either untreated or stimulated with IFN-γ (1,000 U/ml) for 48 hours (n = 15–22). (E) Immunoblot analysis of IL-6R, SOCS3, and β-tubulin in lysates of PBMCs, either unstimulated (0) or stimulated for 48 hours with IFN-γ at 1,000 U/ml, from 1 representative control subject and 1 T1D patient (indicated at the right side). (F) IL-6R/β-tubulin and SOCS3/β-tubulin ratios of scanning densitometry data obtained from immunoblot analyses as in E (all groups, n = 27). Ctrl, nondiabetic subjects. T1D, diabetic patients. Data (mean ± SEM) are the results of 4 independent measurements performed in triplicates. Data in panels A, B, D, and F were analyzed by 2-way ANOVA, followed by post hoc Bonferroni’s test. *P < 0.05; **P < 0.01.
Figure 4
Figure 4. Tocilizumab (TCZ) restores tryptophan catabolism in peripheral blood mononuclear cells (PBMCs) from a subgroup of T1D children.
(A) l-kynurenine (Kyn) levels in supernatants of PBMCs, either unstimulated (medium) or stimulated for 48 hours with IFN-γ at 100 U/ml in the presence or absence of TCZ (10 μM), from control subjects (n = 34) or T1D patients (n = 114). (B) Kyn production as in A from T1D PBMCs subdivided in responders (R; n = 39) vs. nonresponders (NR; n = 75) due to TCZ significant effects detectable in IFN-γ−stimulated cells at the individual level (analyzed in triplicate samples). (C) Kyn production as in B from NR T1D PBMCs further subdivided in IDO1+ (n = 43) vs. IDO1 (n = 32) due to the capacity of IFN-γ to significantly or not significantly upregulate the Kyn production at the individual level (as in B), respectively. (D) TGF-β production from T1D PBMCs, either untreated or treated as in A, and subdivided in TCZ R, NR IDO1+, and NR IDO1 groups. (E) IDO1 rs7820268 and (F) IL6R rs2228145 genotype distribution in R, NR IDO1+, and NR IDO1 T1D PBMCs. (G) Ratios of AC + CC (i.e., protective) and AA (nonprotective) IL6R rs2228145 genotype in R, NR IDO1+, and NR IDO1 T1D PBMCs. Ctrl, nondiabetic subjects. T1D, diabetic patients. Data (mean ± SEM; A–D) are the result of 4 independent measurements performed in triplicate. Kruskal-Wallis with post hoc Dunn’s test was used for the analysis of A. Data in panels BD were analyzed by 2-way ANOVA, followed by post hoc Bonferroni’s test. *P < 0.05; **P < 0.01; ***P < 0.001.
Figure 5
Figure 5. Tocilizumab (TCZ) restores normoglycemia in diabetic NOD mice via an IDO1-dependent mechanism.
NOD mice proficient (AD) or deficient (EH) in Ido1 expression were treated i.p. with saline (control) or TCZ at the dose of 5 mg/kg every other day for 3 weeks and once a week for the next 3 weeks. (A and E) Percentages of diabetic animals (i.e., treated with TCZ or saline when showing a glycemia of 200–250 mg/dl) whose course of glycemia at the individual level is represented over time in B and F (n = 8 per group; 1 experiment representative of 3). (C and G) Histology of 1 representative mouse per group. Scale bars: 50 μM. (D and H) Degree of insulitis in the various groups. Data of diabetes incidence (A and E) were analyzed by Kaplan-Meier and survival curves were compared by log-rank test. ***P < 0.001.

Similar articles

Cited by

References

    1. Steck AK, Rewers MJ. Genetics of type 1 diabetes. Clin Chem. 2011;57(2):176–185. doi: 10.1373/clinchem.2010.148221. - DOI - PMC - PubMed
    1. Nepom GT, Buckner JH. A functional framework for interpretation of genetic associations in T1D. Curr Opin Immunol. 2012;24(5):516–521. doi: 10.1016/j.coi.2012.07.003. - DOI - PMC - PubMed
    1. Smyth DJ, et al. Shared and distinct genetic variants in type 1 diabetes and celiac disease. N Engl J Med. 2008;359(26):2767–2777. doi: 10.1056/NEJMoa0807917. - DOI - PMC - PubMed
    1. Stene LC, et al. Enterovirus infection and progression from islet autoimmunity to type 1 diabetes: the Diabetes and Autoimmunity Study in the Young (DAISY) Diabetes. 2010;59(12):3174–3180. doi: 10.2337/db10-0866. - DOI - PMC - PubMed
    1. Hober D, Sauter P. Pathogenesis of type 1 diabetes mellitus: interplay between enterovirus and host. Nat Rev Endocrinol. 2010;6(5):279–289. doi: 10.1038/nrendo.2010.27. - DOI - PubMed

Publication types

MeSH terms