. 2018 Mar 22;3(6):e94493.
doi: 10.1172/jci.insight.94493.

Allele-specific differences in transcriptome, miRNome, and mitochondrial function in two hypertrophic cardiomyopathy mouse models

Affiliations

Allele-specific differences in transcriptome, miRNome, and mitochondrial function in two hypertrophic cardiomyopathy mouse models

Styliani Vakrou et al. JCI Insight. .

Abstract

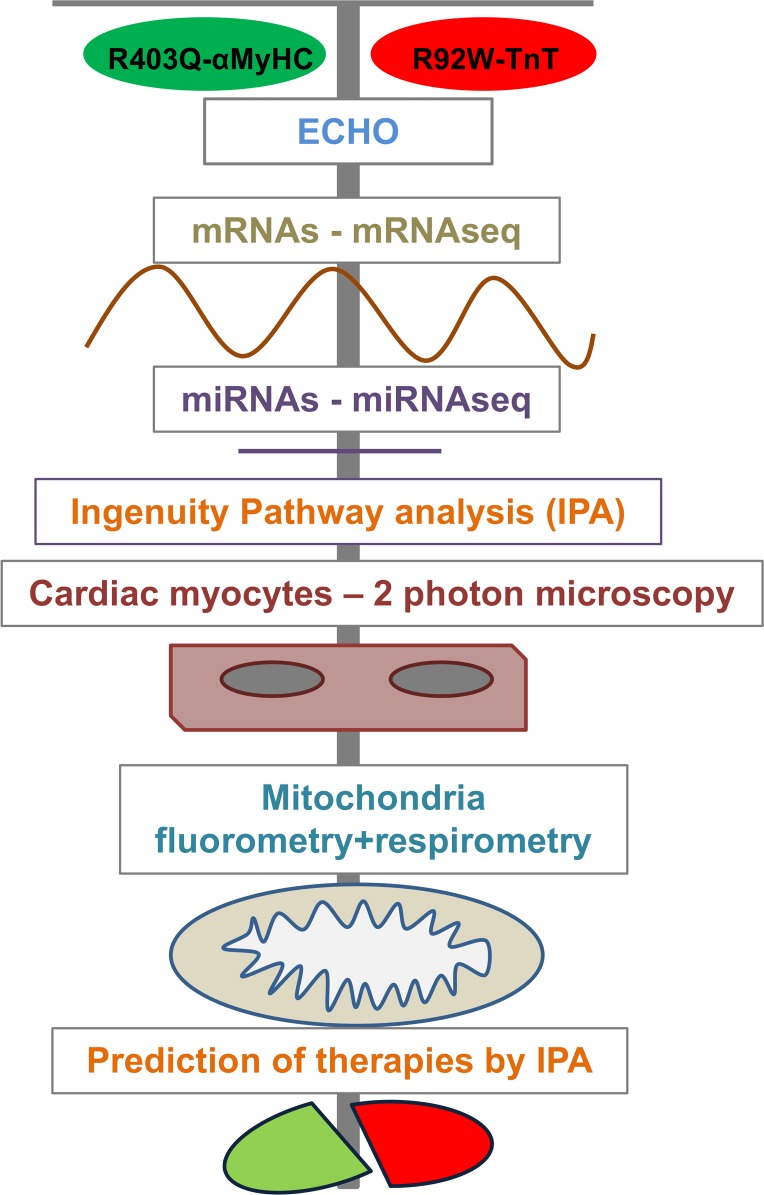
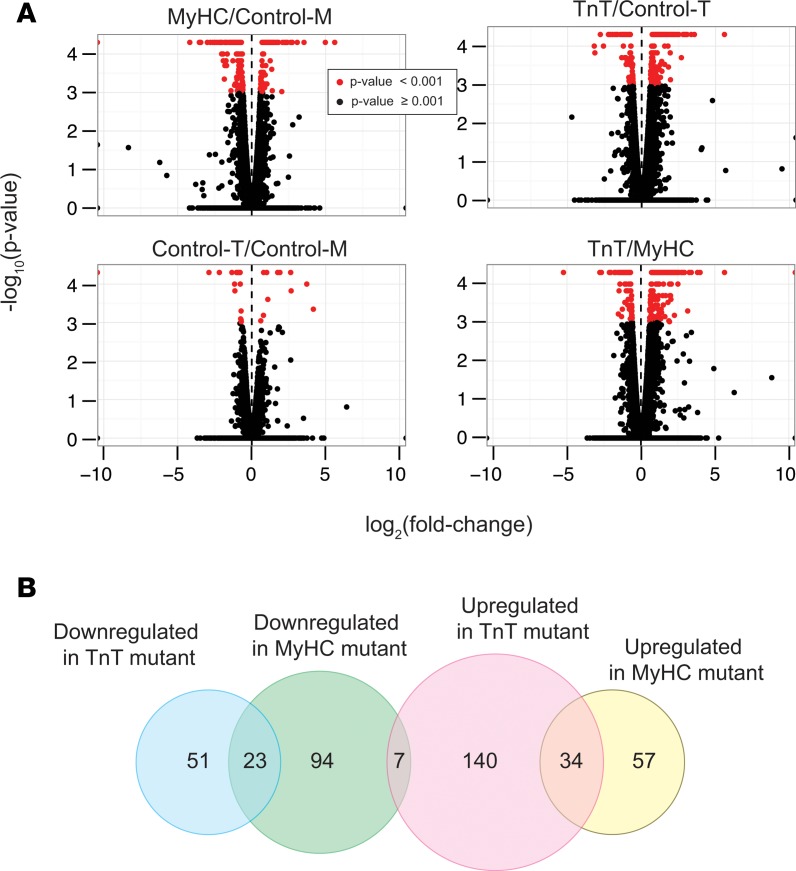
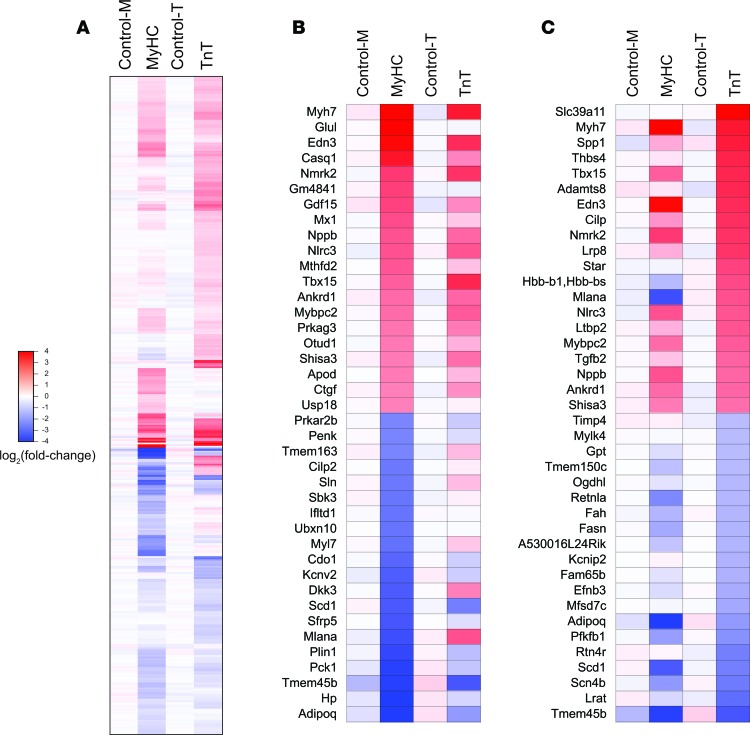
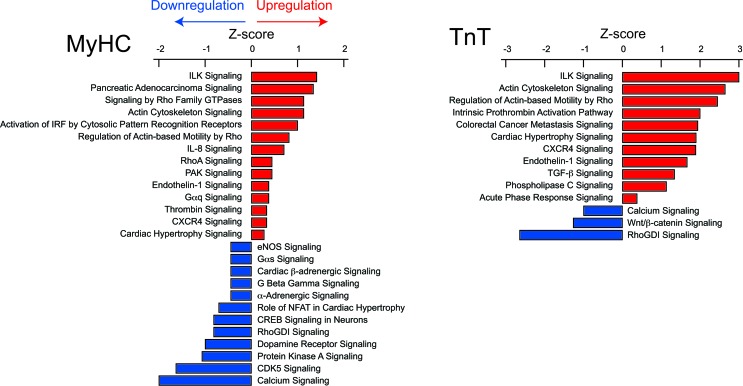
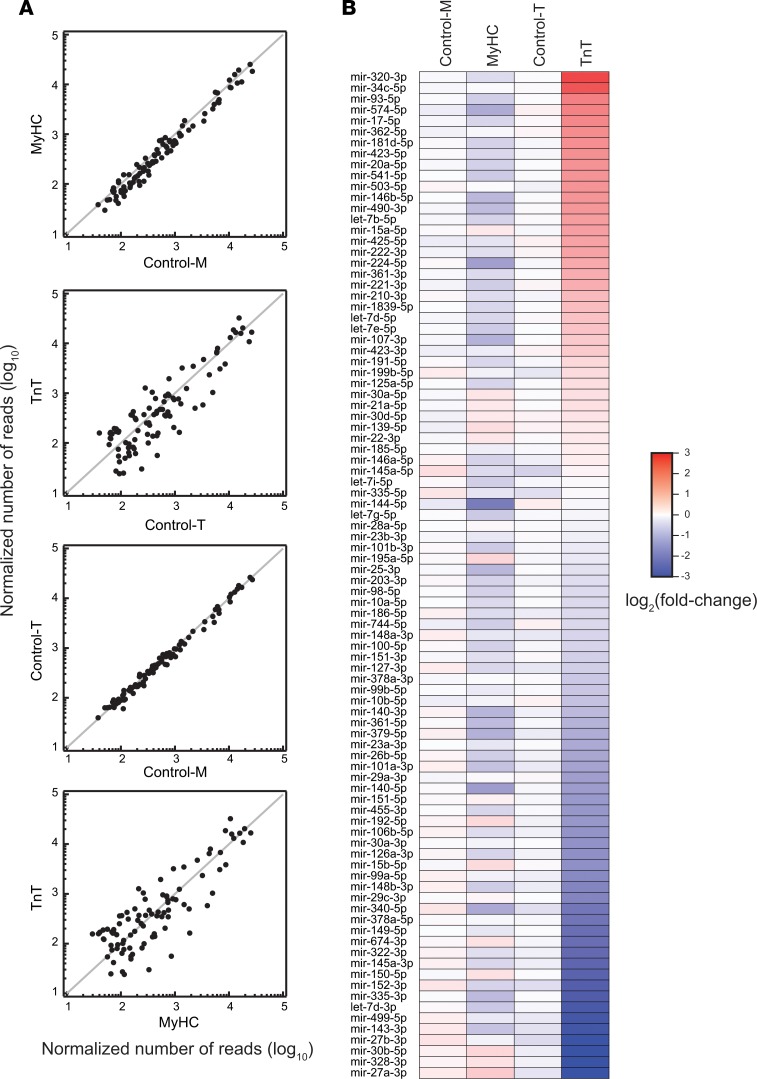
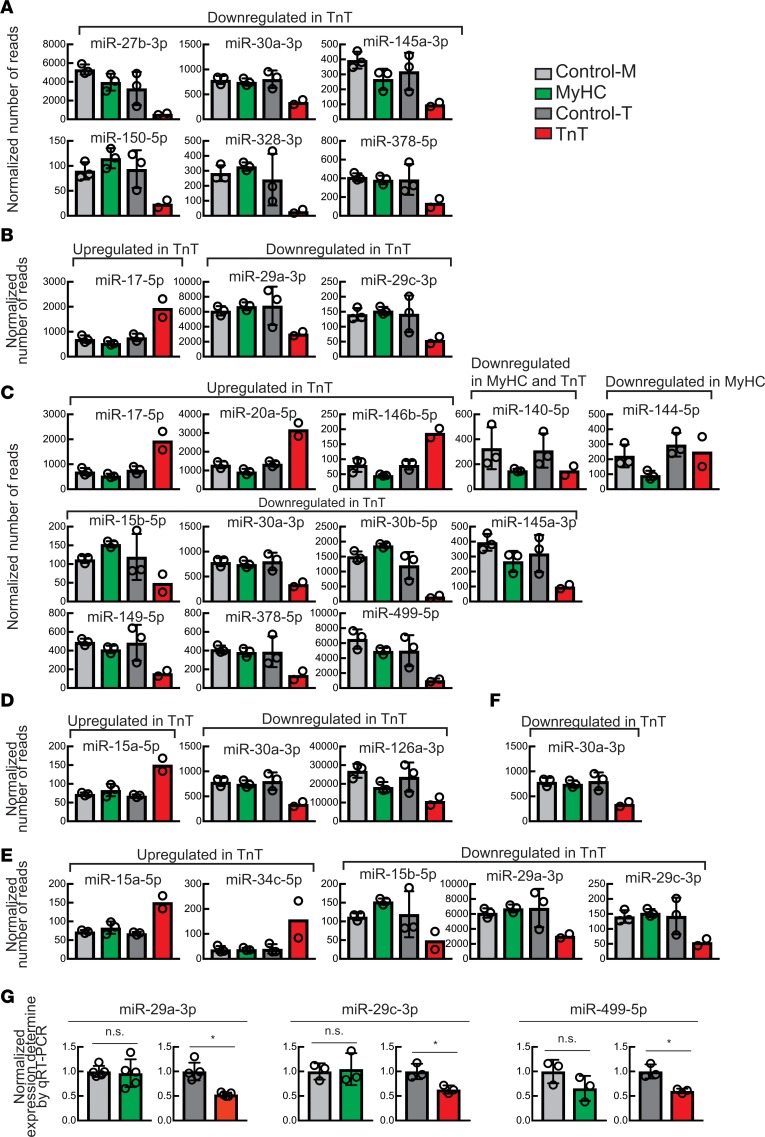
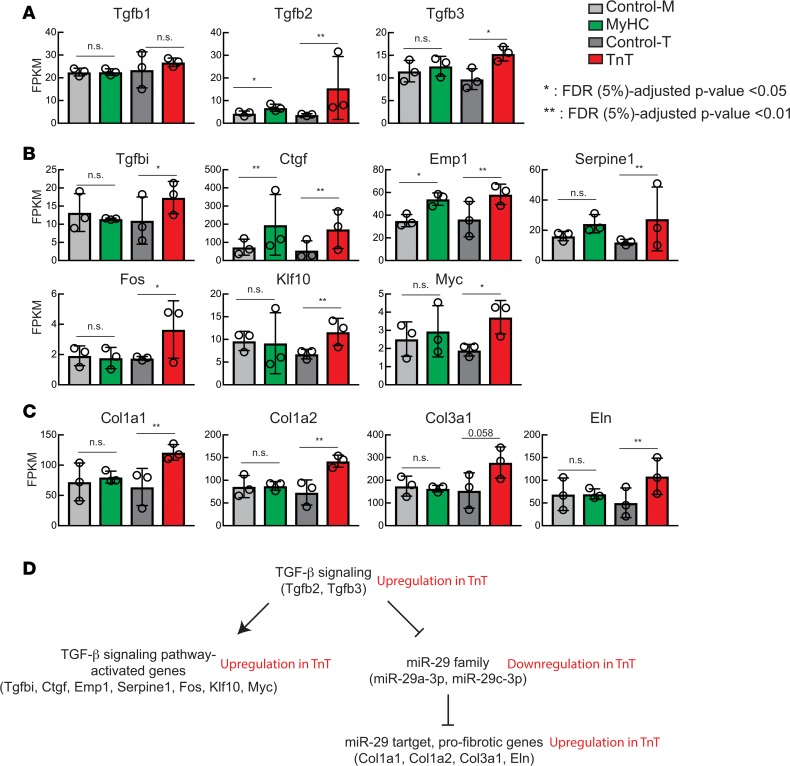
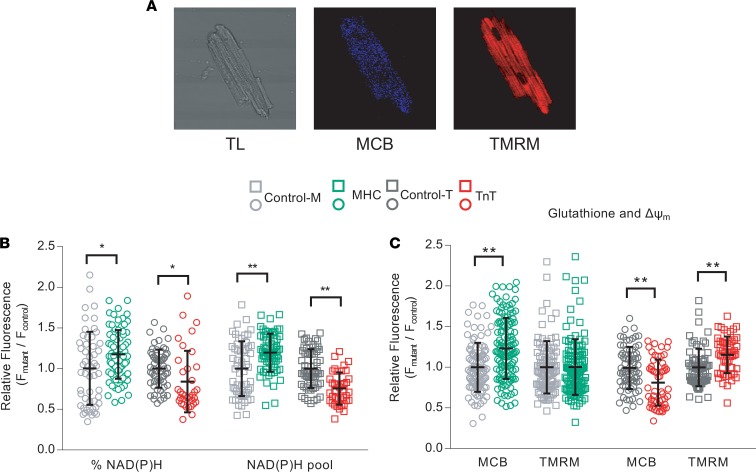
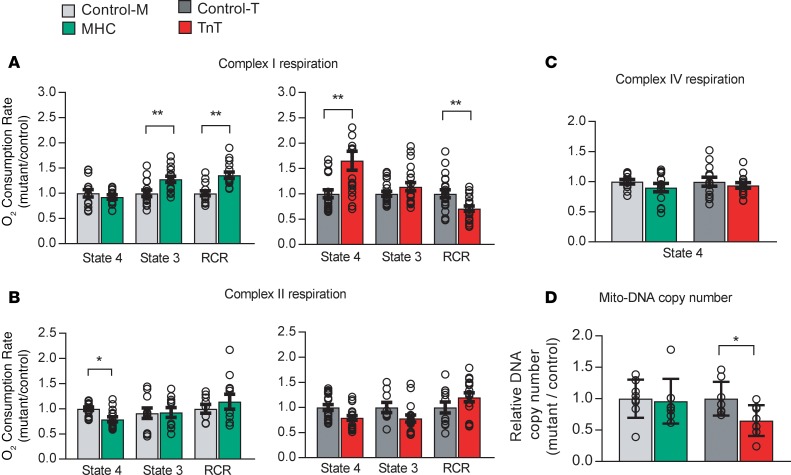
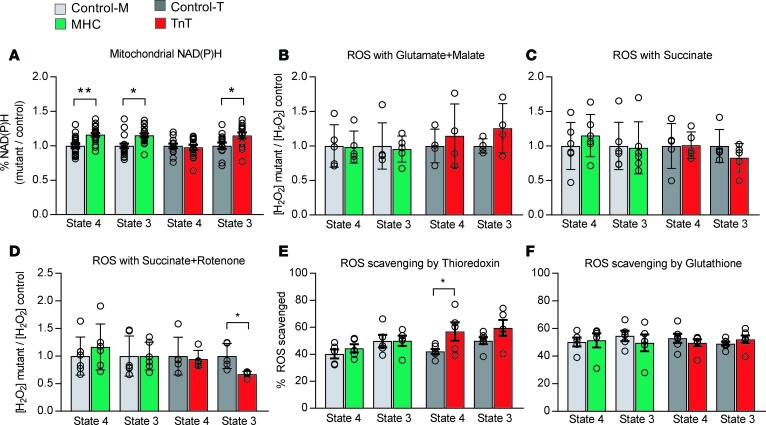
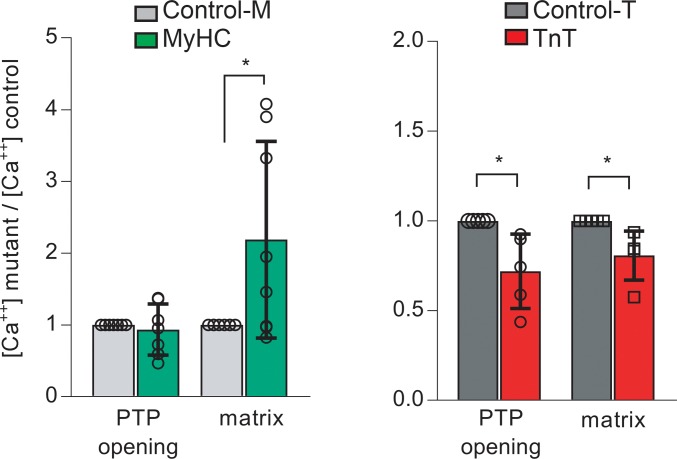
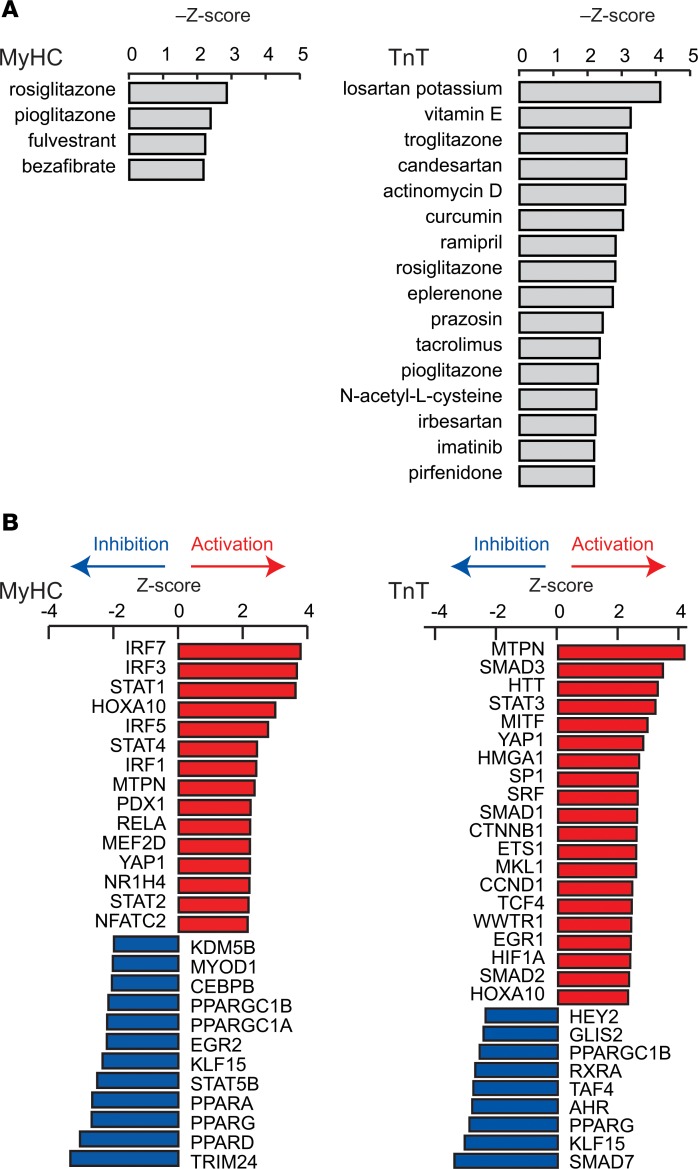
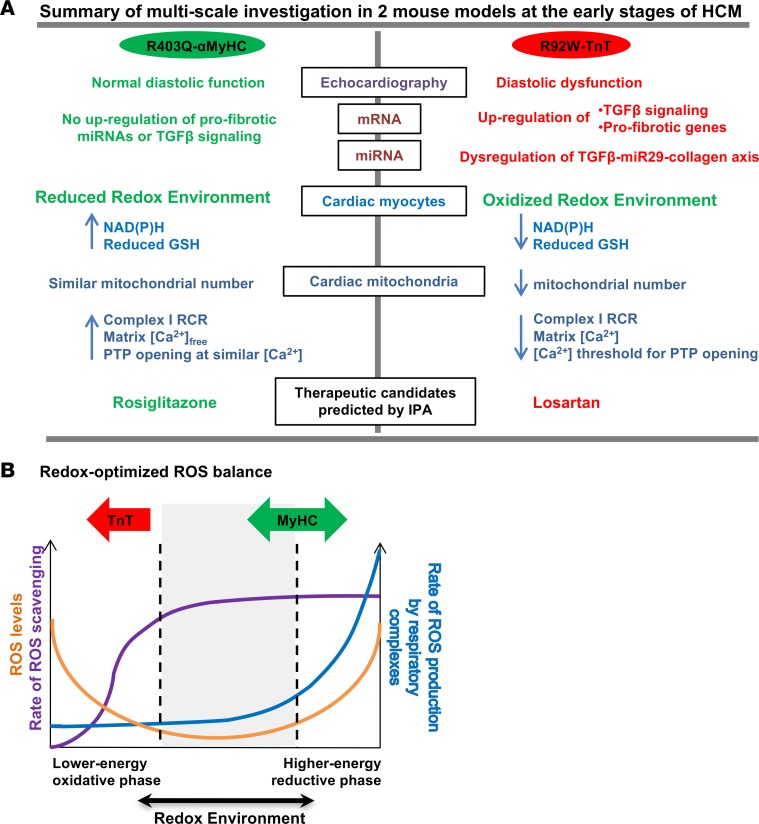
Hypertrophic cardiomyopathy (HCM) stems from mutations in sarcomeric proteins that elicit distinct biophysical sequelae, which in turn may yield radically different intracellular signaling and molecular pathologic profiles. These signaling events remain largely unaddressed by clinical trials that have selected patients based on clinical HCM diagnosis, irrespective of genotype. In this study, we determined how two mouse models of HCM differ, with respect to cellular/mitochondrial function and molecular biosignatures, at an early stage of disease. We show that hearts from young R92W-TnT and R403Q-αMyHC mutation-bearing mice differ in their transcriptome, miRNome, intracellular redox environment, mitochondrial antioxidant defense mechanisms, and susceptibility to mitochondrial permeability transition pore opening. Pathway analysis of mRNA-sequencing data and microRNA profiles indicate that R92W-TnT mutants exhibit a biosignature consistent with activation of profibrotic TGF-β signaling. Our results suggest that the oxidative environment and mitochondrial impairment in young R92W-TnT mice promote activation of TGF-β signaling that foreshadows a pernicious phenotype in young individuals. Of the two mutations, R92W-TnT is more likely to benefit from anti-TGF-β signaling effects conferred by angiotensin receptor blockers and may be responsive to mitochondrial antioxidant strategies in the early stage of disease. Molecular and functional profiling may therefore serve as aids to guide precision therapy for HCM.

Keywords: Cardiology; Cardiovascular disease; Cell Biology; Mitochondria; Transcription.


Conflict of interest statement

Conflict of interest: LAL is a founder and shareholder of MyoKardia Inc.

Figures

Figure 1
Figure 1. Overall design of the study.
Figure 2
Figure 2. mRNA-seq analysis.
(A) Volcano plots showing the log2(fold change) and –log10(P value) of each mRNA in the pairwise comparison of the 2 mouse genotypes; mRNA data with P < 0.001 (q < 0.05) using 2-sided unpaired Student’s t test (n = 3 biological replicates) is depicted in red. (B) Venn diagram illustrating number of genes that are upregulated or downregulated in MyHC and TnT mutants (total number of genes, 406).
Figure 3
Figure 3. mRNA-seq analysis.
(A) Heatmap illustrating fold-change in abundance of each mRNA relative to the mean of the littermate controls (the mean of control-M and control-T); 406 genes were differentially expressed (P < 0.001, q < 0.05, using 2-sided unpaired Student’s t test [n = 3 biological replicates]) in MyHC or TnT mutants, when compared with their respective littermate controls; differences in expression of 14 genes were observed in the 2 controls. The mRNAs are shown in descending order of fold change in abundance in the TnT mutants. (B and C) Heatmap showing fold change in the abundance of each mRNA relative to the mean of control-M and control-T. The top 20 upregulated and downregulated genes in MyHC (B) and TnT (C) mutants are shown. The mRNAs are shown in descending order of fold change in abundance in MyHC (B) and TnT (C) mutants.
Figure 4
Figure 4. Ingenuity pathway analysis of mRNA-seq data.
IPA identified pathways that were significantly (P < 0.032) upregulated (Z score > 0) or downregulated (Z score < 0) in MyHC and TnT mutants. All pathways (P < 0.032), including those whose Z scores could not be determined, are shown in Supplemental Table 4.
Figure 5
Figure 5. miRNA-seq analysis.
(A) Scatter plots illustrate pairwise comparison of the abundance of normalized miRNAs between 2 mouse genotypes. Each dot represents the mean of the normalized number of reads of a unique miRNA (n = 2 biological replicates for TnT, and n = 3 biological replicates for all other mice). Ninety-two miRNAs whose mean abundance was more than 100 reads per million total reads in at least 1 of the 4 mice analyzed are shown. (B) Heatmap depicting fold change of abundance of each miRNA relative to the mean of the littermate controls (the mean of control-M and control-T). The miRNAs are listed so that they are in descending order of fold change in abundance in TnT mutants.
Figure 6
Figure 6. Differentially expressed miRNAs implicated in cardiac disease and mitochondrial function.
(AF) Abundance (reads per million) of miRNAs that show >2-fold change in MyHC or TnT mutants compared with their littermate controls and have been implicated in (A) cardiac hypertrophy, (B) cardiac fibrosis, (C) cardiac apoptosis, (D) mitochondrial function, (E) myocardial infarction, and (F) autophagy. Mean ± SD (n = 2 biological replicates for TnT, and n = 3 biological replicates for all other mice). (G) Normalized expression of miR-29a-3p, miR-29c-3p, and miR-499-5p determined by qRT-PCR. The miRNA levels were normalized by miR-30a-5p level, which did not show change in the miRNA-seq data (Supplemental Table 7). Expression in MyHC and TnT mutants was normalized to that of their respective littermate controls. Mean ± SD (n = 5 biological replicates for miR-29a-3p, and n = 3 biological replicates for miR-29c-3p and miR-499-5p); *P < 0.05 using 2-sided Student’s t test.
Figure 7
Figure 7. TGF-β–miR-29–collagen axis.
(A) mRNA levels (fragments per kilobase of exon per million fragments mapped [FPKM]) of TGF-β genes revealed by mRNA-seq. (B) mRNA levels of genes whose transcription is known to be increased by activation of TGF-β signaling. (C) mRNA levels of collagen and elastin genes that are known to be suppressed by the miR-29 family of miRNAs. (D) Summary of TGF-β–miR-29–collagen axis and changes in TnT mutants. Mean ± SD (n = 3 biological replicates); *P < 0.01 and **P < 0.001, using 2-sided Student’s t test.
Figure 8
Figure 8. Isolated myocyte studies.
Two-photon microscopy. Cardiac myocytes were labeled with monochlorobimane (MCB; 50 μM, blue λem 480 ± 20 nm) and tetramethylrhodamine (TMRM; 100nM, red λem 605 ± 25 nm) at 37°C, to simultaneously monitor reduced glutathione (GSH) and mitochondrial membrane potential (ΔΨm), respectively. Data from mutants is presented as fluorescence units normalized to littermate control data. NAD(P)H was assessed in nonlabeled cells by measuring autofluorescence (total fluorescence collected at <490 nm). Potassium cyanide (KCN; 1 mM) and carbonyl cyanide-4-(trifluoromethoxy)phenylhydrazone (FCCP, 5 μΜ) were used to calibrate the NAD(P)H signal, permitting estimation of the NAD(P)H pool. %NAD(P)H calculation was based on NAD(P)H fluorescence units, normalized to the respective NAD(P)H pool. (A) Cell labeling: Representative images of cardiac myocytes with transmitted light (TL) and fluorescence (2-photon) microscopy, labeled with MCB and TMRM. (B) NAD(P)H: Reduced NAD(P)H and NAD(P)H pool were higher in MyHC mutant myocytes, and lower in TnT mutant myocytes, when compared with respective littermate controls. (C) GSH: MyHC mutant myocytes had higher levels of reduced glutathione and similar ΔΨm, whereas TnT mutant myocytes had lower levels of reduced glutathione and more hyperpolarized ΔΨm, when compared to respective littermate controls. Data are presented as mean ± SD. We present results from 3 mouse hearts in each mutant and control group, with n = 20–30 cells from each mouse for NAD(P)H and GSH/ΔΨm measurements, after pooling the 3 datasets (each data point was derived from a single cardiac myocyte). Statistical significance of the difference between each mutant and the respective littermate control was examined using 2-sided unpaired Student’s t test. *P < 0.05; ** P < 0.001.
Figure 9
Figure 9. Mitochondrial studies.
Respirometry: Mitochondria were freshly isolated from mutant and littermate control hearts, in parallel. An XF96 analyzer was used to measure function of complexes I, II, and IV at 37°C. Oxygen consumption rate (OCR) was measured in state 4 (no ADP) and/or state 3 (with 1 mM ADP) using substrates for the electron transport chain (ETC) complex I (5 mM glutamate/malate), complex II (5 mM succinate, in the presence of rotenone, an ETC-complex I inhibitor), and complex IV (0.5 mM TMPD [N,N,N,N′-tetramethyl-p-phenylenediamine]). Coupling of O2 consumption to ADP phosphorylation was estimated by computing the respiratory control ratio (RCR; state 3/state 4 respiration). (A) Complex I respiration: MyHC mutants had higher state 3 respiration and higher RCR, whereas TnT mutants had higher state 4 respiration and lower RCR, when compared with respective littermate controls. (B) Complex II respiration: MyHC mutants had lower state 4 respiration, but complex II RCR of MyHC mutants was similar to that of controls. No difference was noted between TnT mutants/controls. (C) Complex IV respiration in both mutants was similar to respective littermate controls. Data are presented as mean ± SEM. n = 15 experiments from 5 mitochondrial preparations/10 mice in each group for control-M/MyHC, and n = 21 experiments from 7 mitochondrial preparations/14 mice in each group for control-T/TnT. *P < 0.05, **P < 0.001, using 2-sided unpaired Student’s t test and Bonferroni’s correction for multiple testing. (D) Mitochondrial number: Total DNA was isolated from whole hearts for qRT-PCR of COX-1 (mitochondrial gene) and GAPDH (nuclear gene). Mitochondrial DNA (Mito-DNA) copy number is presented as relative copy number of COX-I/GAPDH. Copy numbers in each mutant were normalized to copy numbers in respective littermate controls. MyHC hearts had similar mitochondrial DNA copy number, whereas TnT mutants had lower mitochondrial DNA copy number, when compared with respective littermate controls. Data are presented as mean ± SD. n = 8 hearts in each group. *P < 0.05, **P < 0.01, using 2-sided unpaired Student’s t test.
Figure 10
Figure 10. Isolated mitochondrial studies II — redox.
Mitochondrial redox: Freshly isolated mitochondria from mutants and respective littermate controls were assayed in parallel using a fluorometer. (A) NAD(P)H oxidation (autofluorescence: λexc: 340, λem: 450 nm) was examined in the presence of complex I substrates (5 mM glutamate/malate) during state 4 and state 3 respiration. The NAD(P)H signal was calibrated by adding KCN (2.5 mM) and 2,4-dinitrophenol (DNP, 20 μΜ) at the end of each experiment. MyHC mutants had higher levels of reduced NAD(P)H during state 4 and 3 respiration. TnT mutants had higher levels of reduced NAD(P)H at the end of state 3 respiration when compared with littermate controls, because of lower oxidation of NAD(P)H by complex I during the state 4 to state 3 transition. Data are presented as relative ratios: MyHC/control-M and TnT/control-Tm. n = 21 experiments from 7 mitochondrial preparations/14 mice in control-M/MyHC group; n = 15 experiments from 5 mitochondrial preparations/10 mice in control-T/TnT group. (BD) ROS emission: Mitochondria were incubated in Amplex Red (10 μΜ) for assessment of H2O2 emission by fluorometry (λexc: 530 nm and λem: 590 nm). H2O2 emission was assessed during state 4 and state 3 respiration, in the presence of glutamate/malate or succinate with/without rotenone at 37°C. H2O2 (100 pM) was used for signal calibration at the end of each experiment. The 2 mutants demonstrated H2O2 emission similar to that of the respective controls. Inhibition of complex I by rotenone led to lower H2O2 emission during state 3 respiration (P = 0.01). n = 5 experiments from 5 mitochondrial preparations/10 mice in each group for control-M/MyHC, and n = 4 experiments from 4 mitochondrial preparations/8 mice in each group for control-T/TnT. (E and F) ROS scavenging: Isolated mitochondria were incubated at 37°C in the presence of Amplex Red to monitor H2O2 during state 4 and state 3 respiration, with glutamate/malate (5/5 mM) and inhibitors of thioredoxin (50 nM auranofin) and/or glutathione (10 μM dinitrochlorobenzene [DNCB]) systems. Lower ROS scavenging by the thioredoxin system during state 4 was observed in TnT mutants. No other differences in ROS scavenging were detected. In AF, data are presented as mean ± SD. n = 5 experiments from 5 mitochondrial preparations/10 mice in each group for control-M/MyHC and control-T/TnT. *P < 0.05 and **P < 0.001, using 2-sided unpaired Student’s t test.
Figure 11
Figure 11. Isolated mitochondrial studies III — calcium handling.
Mitochondrial calcium handling: Mitochondria were isolated in parallel from mutant and littermate control hearts. Extra- and intra-mitochondrial [Ca+2] were monitored simultaneously by fluorometry at room temperature, in freshly isolated, energized mitochondria (state 4 respiration with 5 mM glutamate/malate), using 0.1 μM Calcium Green-5N (λexc:505, λem:535 nm) and 20 μM Fura-FF (λexc:340 and 380 nm, λem:510 nm), respectively. Repeated CaCl2 (5 μM) additions were performed until permeability transition pore (PTP) activation was detected. Mutant data were normalized to corresponding littermate control results. MyHC mutants demonstrated higher matrix intramitochondrial [Ca2+]free, but PTP activation occurred at [Ca2+] similar to that of controls. TnT mutants had lower matrix [Ca2+]free and PTP activation at lower [Ca2+] than controls. Data are presented as mean ± SD. n = 8 experiments from 5 mitochondrial preparations/10 mice in each group for control-M/MyHC, and n = 5 experiments from 5 mitochondrial preparations/10 mice in each group for control-T/TnT. *P < 0.05, using 2-sided 1-sample t test.
Figure 12
Figure 12. Identification of candidate therapeutics and upstream transcriptional regulators.
(A) Candidate therapeutics that are predicted to revert the dysregulated signaling pathways in the mutants back to that in controls. Candidate therapeutics with –Z scores >2.19 are shown. (B) Predicted change in the activity of transcriptional regulators that can explain dysregulation of the signaling pathways shown in Figure 2 in mutants. Transcriptional regulators with Z scores >2.3 or <–2.3 are shown for MyHC mutants and >2.0 or <–2.0 for TnT mutants
Figure 13
Figure 13. Allele-specific differences in HCM revealed by analysis of transcriptome and mitochondrial function in 2 mouse models — schematic summary.
(A) Summary of multiscale studies performed in R403Q-αMyHC and R92W-TnT mutant mice along with littermate controls at the early stage of HCM. We found differences in cardiac function, mRNA/miRNA expression, mitochondrial number, redox, calcium handling, signaling, and predicted therapies in the 2 mutant mice. (B) Based on our results and the redox-optimized ROS balance hypothesis (42), MyHC mutants appear to reside at an optimal reduced phase, whereas TnT mutants lie in a lower-energy oxidative phase. Figure adapted from ref. .j

References

    1. Maron BJ. Hypertrophic cardiomyopathy: a systematic review. JAMA. 2002;287(10):1308–1320. - PubMed
    1. Ho CY, et al. Myocardial fibrosis as an early manifestation of hypertrophic cardiomyopathy. N Engl J Med. 2010;363(6):552–563. doi: 10.1056/NEJMoa1002659. - DOI - PMC - PubMed
    1. Maron BJ, Maron MS. Hypertrophic cardiomyopathy. Lancet. 2013;381(9862):242–255. doi: 10.1016/S0140-6736(12)60397-3. - DOI - PubMed
    1. Maron BJ, Gardin JM, Flack JM, Gidding SS, Kurosaki TT, Bild DE. Prevalence of hypertrophic cardiomyopathy in a general population of young adults. Echocardiographic analysis of 4111 subjects in the CARDIA Study. Coronary Artery Risk Development in (Young) Adults. Circulation. 1995;92(4):785–789. doi: 10.1161/01.CIR.92.4.785. - DOI - PubMed
    1. Vakrou S, Abraham MR. Hypertrophic cardiomyopathy: a heart in need of an energy bar? Front Physiol. 2014;5:309. - PMC - PubMed

Publication types

MeSH terms