. 2018 Mar 22;3(6):e99171.
doi: 10.1172/jci.insight.99171.

Neuropathic pain in a Fabry disease rat model

Affiliations

Neuropathic pain in a Fabry disease rat model

James J Miller et al. JCI Insight. .

Abstract

Fabry disease, the most common lysosomal storage disease, affects multiple organs and results in a shortened life span. This disease is caused by a deficiency of the lysosomal enzyme α-galactosidase A, which leads to glycosphingolipid accumulation in many cell types. Neuropathic pain is an early and severely debilitating symptom in patients with Fabry disease, but the cellular and molecular mechanisms that cause the pain are unknown. We generated a rat model of Fabry disease, the first nonmouse model to our knowledge. Fabry rats had substantial serum and tissue accumulation of α-galactosyl glycosphingolipids and had pronounced mechanical pain behavior. Additionally, Fabry rat dorsal root ganglia displayed global N-glycan alterations, sensory neurons were laden with inclusions, and sensory neuron somata exhibited prominent sensitization to mechanical force. We found that the cation channel transient receptor potential ankyrin 1 (TRPA1) is sensitized in Fabry rat sensory neurons and that TRPA1 antagonism reversed the behavioral mechanical sensitization. This study points toward TRPA1 as a potentially novel target to treat the pain experienced by patients with Fabry disease.

Keywords: Genetic diseases; Glycobiology; Neuroscience; Pain.


Conflict of interest statement

Conflict of interest: The authors have declared that no conflict of interest exists.

Figures

Figure 1
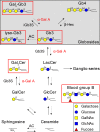
Figure 1. Biosynthesis and degradation of globoside glycosphingolipids (GSLs).
GSLs are synthesized (solid arrows) by the sequential addition of monosaccharides to ceramide. Globotriaosylceramide synthase (Gb3S) catalyzes the addition of α-1,4-galactose to lactosylceramide (LacCer), which produces globotriaosylceramide (Gb3). Isoglobotriaosylceramide synthase (iGb3S) can add additional α-1,3-galactose residues to Gb3, forming polygalactosylated species (Galn-Gb3). GSL degradation (dashed arrows) occurs in lysosomes by acid hydrolases. β-Hexosaminidase (β-Hex) removes terminal N-acetylgalactosamine (GalNAc) from globotetraosylceramide (Gb4). Acid ceramidase (AC) removes the fatty acid chain from Gb3 to form globotriaosylsphingosine (lyso-Gb3). α-Galactosidase A (α-Gal A, red) removes terminal α-galactose residues from GSLs. In Fabry disease, α-Gal A is deficient, and substrates containing terminal α-galactose (e.g., Gb3, lyso-Gb3, galabiosylceramide [Gal2Cer], blood group B GSLs) accumulate. Globoside GSLs are shown in the shaded gray box. GSLs whose abundance increases in Fabry rats are contained within the red boxes. Graphical representations of monosaccharide residues are shown in the boxed legend and are consistent with the symbol nomenclature for glycans. GalCer, galactosylceramide; GlcCer, glucosylceramide; GlcNAc, N-acetylglucosamine.
Figure 2
Figure 2. Fabry rat generation and activities of selected lysosomal enzymes.
(A) The rat Gla gene encodes α-galactosidase A (α-Gal A), and consists of 7 exons (light blue rectangles). The genomic locations of highly conserved, catalytic residues (Asp172 and Asp233) are identified by the black triangles. A portion of the nucleotide sequence of exon 2 is shown with the CRISPR target highlighted, along with the Cas9 cleavage site. The protospacer adjacent motif (PAM) site is also identified. Translations of the WT (black) and the KO (–47 bp deletion, red) sequences are also shown with the premature stop codon (#). (B–D) Lysosomal enzymes were assayed in rat serum and liver using 4-methylumbelliferyl (4-MU) substrates for α-Gal A (B), β-hexosaminidase (C), and α-mannosidase (D). Enzyme activity was measured in male (unshaded) and female (shaded) 13-week-old rat tissues, and each symbol represents a biological replicate, each containing 3 technical replicates. Serum biological replicates include n = 8 for each genotype and sex. Liver biological replicates include n = 7 for WT males, KO males, WT females, and heterozygous (HET) females and n = 4 for KO females. The horizontal dashed line in B indicates the threshold of detection. Shown are mean ± SEM. Male means were compared using an unpaired, 2-tailed t test. Female means were compared using 1-way ANOVA and Dunnett’s multiple comparison test. ****P < 0.0001.
Figure 3
Figure 3. Glycosphingolipids (GSLs) in Fabry rat serum and RBCs.
GSLs were extracted from serum (A) and RBC (B) from 13-week-old male rats (n = 3 WT, n = 3 KO). Following purification and permethylation, GSLs were analyzed and quantified by nanospray ionization–mass spectrometry. Note the log scale on the y axis in B. Shown are mean ± SEM, and means were compared using unpaired, 2-tailed t tests to determine genotype differences in GSLs. If GSL means in KO rats were statistically elevated above WT means, the fold increase is shown above in red. GSLs detected in KO, but not WT, serum and RBCs are highlighted with light blue boxes. Lyso-Gb3, globotriaosylsphingosine; Gb3, globotriaosylceramide; Gb4, globotetraosylceramide; GM3, monosialoganglioside GM3; CMH, ceramide monohexoside; CDH, ceramide dihexoside; Gal, galactose; GT1, trisialoganglioside GT1; GD1, disialoganglioside GD1; GM1, monosialoganglioside GM1.*P < 0.05, ***P < 0.001.
Figure 4
Figure 4. Glycosphingolipid (GSL) storage in Fabry rat brain and dorsal root ganglia.
(A) Extracted GSLs from 13-week-old male rat brains (3 WT, 3 KO) were analyzed by TLC using a solvent system of chloroform/methanol/water (60:40:10, v/v/v). (B) GSLs from the 3 WT and 3 KO male brains in A were quantified by nanospray ionization–mass spectrometry (NSI-MS) (note the log scale on the y axis). (C) GSLs were extracted from 13-week-old dorsal root ganglia (DRG) and were analyzed by TLC using a solvent system of chloroform/methanol/water (60:35:8, v/v/v). (D) NSI-MS was used to quantify GSLs from WT and KO DRG (note the log scale on the y axis). WT DRG quantification consists of 2 WT males and 1 WT female, and KO DRG quantification consists of 2 KO males and 1 KO female. Gb3 species are outlined with the red box in A and C. In B and D, mean ± SEM are shown and GSL means from WT and KO samples are compared using unpaired, 2-tailed t tests. If a significant difference in mean is detected, the fold increase in KO GSL is shown above in red. GSL species detected in KO, but not WT, DRG are highlighted with light blue boxes. CMH, ceramide monohexoside; CDH, ceramide dihexoside; Gb3, globotriaosylceramide; Gb4, globotetraosylceramide; lyso-Gb3, globotriaosylsphingosine; GQ1, tetrasialoganglioside GQ1; GT1, trisialoganglioside GT1; GD1, disialoganglioside GD1; GD3, disialoganglioside GD3; GM1, monosialoganglioside GM1; GM2, monosialoganglioside GM2; GM3, monosialoganglioside GM3; Gal, galactose; HET, heterozygous. *P < 0.05, **P < 0.01.
Figure 5
Figure 5. Complex and hybrid N-glycans are decreased in Fabry rat dorsal root ganglia (DRG).
N-glycans were prepared from DRG obtained from males at 13 weeks of age. Full mass spectra from WT (top) and KO (bottom) are shown. Peaks colored magenta report the abundance of the annotated high-mannose glycans. Structural assignments for complex and hybrid N-glycans are based on collision-induced dissociation fragmentation performed in nanospray ionization–tandem mass spectrometry analyses of the released, permethylated glycans. The maltotetraose (Dp4) peak corresponds to a standard permethylated glycan that was added to both samples to give the same final concentration, providing a reference for comparing glycan quantities. The sulfated, disialylated hybrid structure, detected at m/z 1416 (m+Na)2+ and 952 (m+Na)3+ is one of the glycans that exhibits a striking decrease in Fabry rat DRG (Structure 19 in Supplemental Table 1 and Supplemental Figure 3, fragmented in Supplemental Figure 4).
Figure 6
Figure 6. Fabry rat dorsal root ganglia (DRG) sensory neurons are swollen with substrates containing terminal α-galactose.
(A) Paraffin sections from DRG were stained with Griffonia simplicifolia isolectin B4 at young (13 weeks, 2 WT and 2 KO) and old (90 weeks, 3 WT and 3 KO) ages. Representative images are shown. Insets show isolectin B4 in the presence of 500 mM galactose as a lectin specificity control. (B) Isolectin B4 stained sections as in A, but magnified. (C) Representative brightfield images of cultured DRG neurons. (D) Histograms showing the binned cell diameter frequency of cultured DRG neurons from 3 WT and 3 KO male rats between 19–21 weeks. Inset shows mean cell diameter ± SEM, and means were compared with an unpaired, 2-tailed t test. Scale bars represent 250 μm (A), 50 μm (A inset and B), and 30 μm (C). ****P < 0.0001.
Figure 7
Figure 7. Fabry rat dorsal root ganglia (DRG) sensory neurons are inclusion laden.
(A) Semi-thin sections from plastic-embedded DRG from rats at 13 weeks were stained with toluidine blue and representative images (from 2 WT males, 3 KO males, 2 WT females, 2 HET females, and 2 KO females) are shown. Examples of small (closed arrow) and large (open arrow) diameter soma are shown. (B) Representative DRG sensory neuron electron microscopy images from 3 KO and 2 WT males at 13 weeks are shown. (C) Magnified electron microscopy images of KO sensory neurons showing various inclusion morphologies. Scale bars represent 50 μm (A), 2 μm (B), and 500 nm (C).
Figure 8
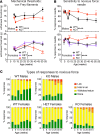
Figure 8. Fabry rats are more sensitive to mechanical touch and noxious force.
(A) The von Frey up-down method was performed on WT and KO male and WT, heterozygous (HET), and KO female rat hind paws, and withdrawal thresholds were compared. (B) A 25-gauge spinal anesthesia needle was applied to rat hind paws 10 times, and the percent response to the needle was recorded. (C) At each time point (4, 6, 10, 12, 25, 38, and 51 weeks), the frequency of response type to the needle is shown. A and B show mean ± SEM and include ≥8 individual rats in each data point. See Supplemental Tables 3 and 4 for the precise number of animals studied at each time point. Two-way ANOVA was performed on A and B to determine the overall genotype effect, and the significance is shown to the right of each legend. To determine genotype differences at each time point studied, multiple comparisons with Bonferroni’s correction were performed. *P < 0.05, **P < 0.01, ***P < 0.001, ****P < 0.0001.
Figure 9
Figure 9. Fabry rat sensory neurons exhibit larger mechanically activated currents than WT.
(A) Cultured primary sensory neurons were patched, and a stimulating pipette was used to poke the neuron cell membrane. Below the schematic are example current traces from 1 WT (black) and 1 KO (red) neuron, both indented 5.04 μm. (B) Patched WT and KO neurons were indented with the stimulating pipette in increasing distances (0.84–6.72 μm), and the resulting current density (current normalized to cell capacitance) was recorded. The total respective number of WT and KO neurons patched: 38 and 44 (0.84 μm); 38 and 44 (1.68 μm); 38 and 42 (2.46 μm); 35 and 34 (3.28 μm); 31 and 22 (4.20 μm); 23 and 17 (5.04 μm); 13 and 14 (5.88 μm); and 8 and 5 (6.72 μm). Two-way ANOVA with Bonferroni post hoc analysis was performed. (C) The indentation required to elicit the first mechanical current is plotted. WT and KO mechanical threshold medians were compared using a Mann-Whitney test. (D) Neuron capacitance is plotted and means were compared with an unpaired, 2-tailed t test. (E) Example traces showing the different type of inward currents observed in sensory neurons. (F) Current profiles are shown for WT and KO neurons and were compared with a χ2 test. (G) For whole cell patch clamping, the goal is to first form a giga-ohm (GΩ) seal between the cell and patch pipette before breaking into the cell. Neuron fragility was judged on whether the patch pipette automatically broke into the cell rather than first forming the GΩ seal. Data were compared with χ2 and Fisher’s exact tests. (H) Resting membrane potentials are plotted for both WT and KO neurons, and means were compared with an unpaired, 2-tailed t test. (I) Rheobase, which is the amount of current required to elicit the first action potential, is plotted for both WT and KO and were compared with a Mann-Whitney test. B, D, and H show mean ± SEM. Sensory neurons were cultured from 3 WT and 3 KO rats ranging from 19–21 weeks of age. *P < 0.05, **P < 0.01, ***P < 0.001, ****P < 0.0001
Figure 10
Figure 10. Transient receptor potential ankryin 1 (TRPA1) is a therapeutic target for treating Fabry disease neuropathic pain.
(A) Example traces from calcium imaging experiments showing fluorescence ratios (340/380 nm) with time. Solutions containing allyl isothiocyanate (mustard oil, MO) or K+ were applied as indicated by the arrows. Traces had a greater than 20% increase in response to MO are shown in blue. (B) The number of small diameter (≤32 μm) and large diameter (>32 μm) neurons responding to 30 μM MO. Numbers of responding neurons and total neurons are shown inside each bar. Neurons are from 3 WT and 3 KO male rats at 19–21 weeks. Fisher’s exact test was used to compare WT and KO neuron response percentages. (C) Same as in B, but with 300 nM capsaicin applied. TRPV1, transient receptor potential vanilloid 1. (D) WT and KO male rats at 35–36 weeks were intraplantarly injected with TRPA1 antagonist, HC-030031, or vehicle (n = 4 each group, 16 total rats). An 8.8 g von Frey filament was applied repeatedly to the hind paw, and the response frequency was determined. Significance was determined using 2-way ANOVA and Bonferroni’s post-hoc test. (E) Same as in D, but a needle was applied repeated to the hind paw, and the response frequency was determined. Mean ± SEM are represented in D and E. *P < 0.05, **P < 0.01, ****P < 0.0001.

Similar articles

Cited by

References

    1. Germain DP. Fabry disease. Orphanet J Rare Dis. 2010;5:30. - PMC - PubMed
    1. Desnick RJ, et al. Fabry disease, an under-recognized multisystemic disorder: expert recommendations for diagnosis, management, and enzyme replacement therapy. Ann Intern Med. 2003;138(4):338–346. doi: 10.7326/0003-4819-138-4-200302180-00014. - DOI - PubMed
    1. Vedder AC, et al. The Dutch Fabry cohort: diversity of clinical manifestations and Gb3 levels. J Inherit Metab Dis. 2007;30(1):68–78. doi: 10.1007/s10545-006-0484-8. - DOI - PubMed
    1. Üçeyler N, Ganendiran S, Kramer D, Sommer C. Characterization of pain in fabry disease. Clin J Pain. 2014;30(10):915–920. doi: 10.1097/AJP.0000000000000041. - DOI - PubMed
    1. Ohshima T, et al. alpha-Galactosidase A deficient mice: a model of Fabry disease. Proc Natl Acad Sci USA. 1997;94(6):2540–2544. doi: 10.1073/pnas.94.6.2540. - DOI - PMC - PubMed

Publication types

MeSH terms