. 2018 Mar 22;50(3):1.
doi: 10.1038/s12276-017-0005-x.

Neural stem cells from a mouse model of Rett syndrome are prone to senescence, show reduced capacity to cope with genotoxic stress, and are impaired in the differentiation process

Affiliations

Neural stem cells from a mouse model of Rett syndrome are prone to senescence, show reduced capacity to cope with genotoxic stress, and are impaired in the differentiation process

Nicola Alessio et al. Exp Mol Med. .

Abstract

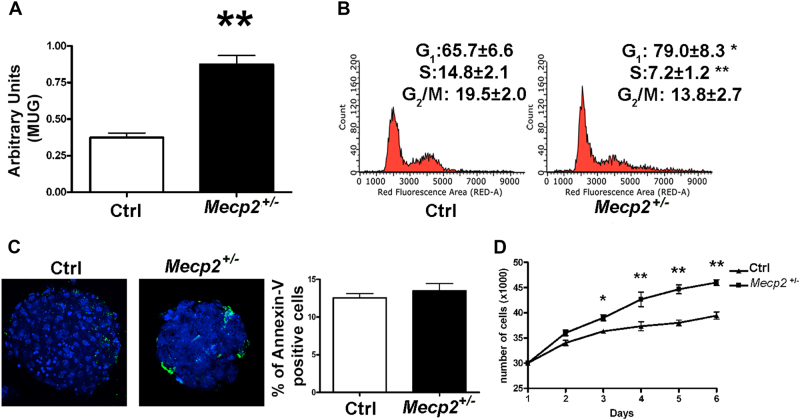
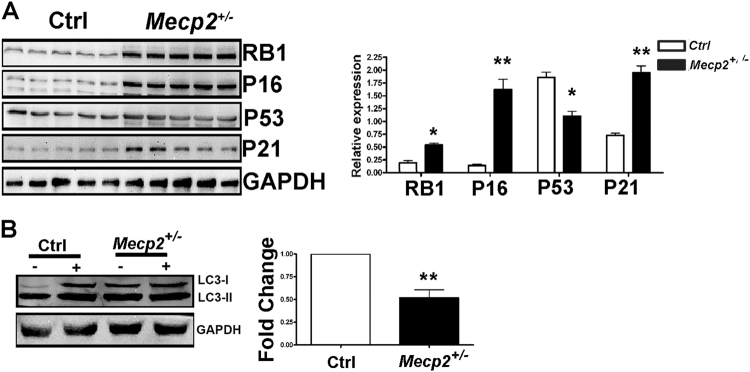
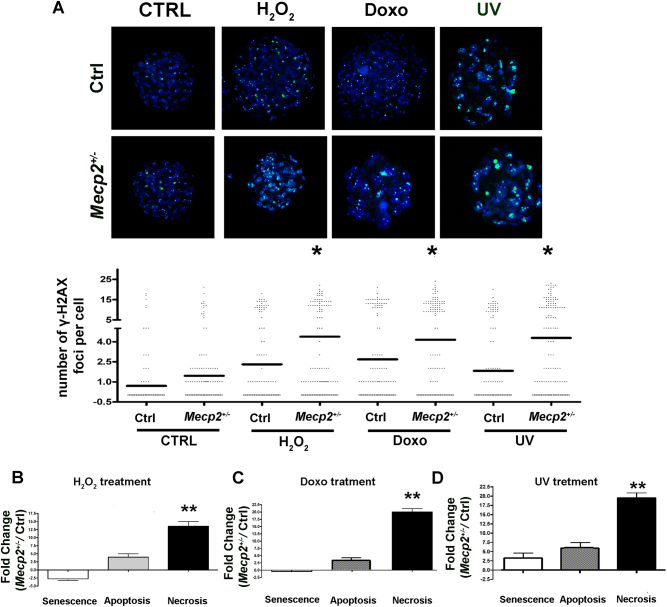
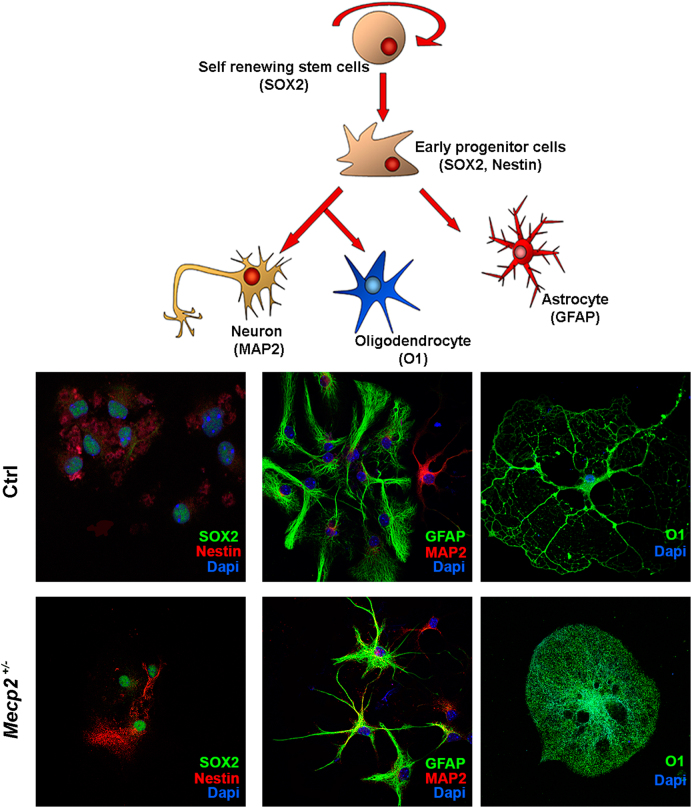
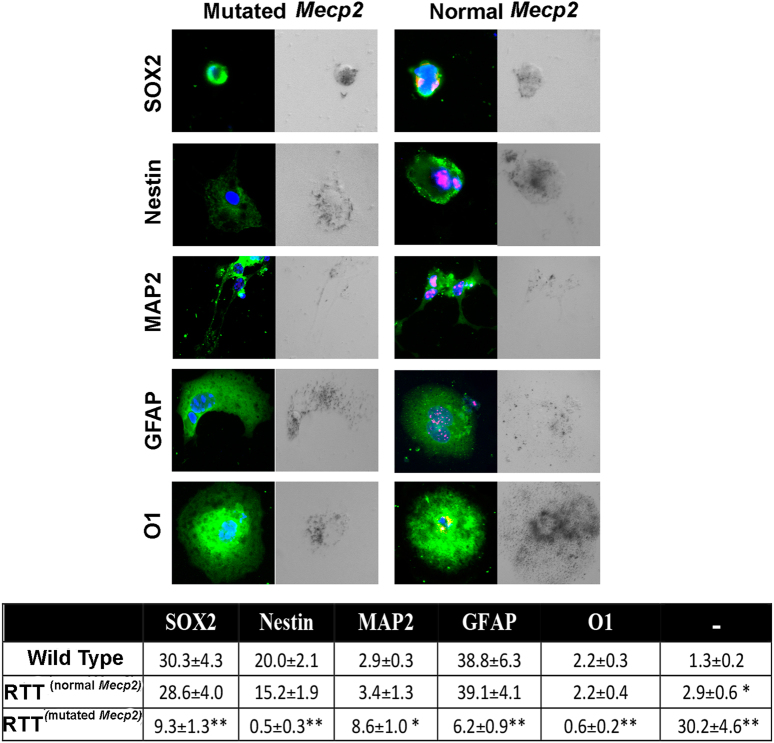
Several aspects of stem cell life are governed by epigenetic variations, such as DNA methylation, histone modifications, and chromatin remodeling. Epigenetic events are also connected with the impairment of stem cell functions. For example, during senescence, there are significant changes in chromatin organization that alter transcription. The MECP2 protein can bind methylated cytosines and contribute to regulating gene expression at one of the highest hierarchical levels. Researchers are particularly interested in this protein, as up to 90% of Rett syndrome patients have an MECP2 gene mutation. Nevertheless, the role of MECP2 in this disease remains poorly understood. We used a mouse model of Rett syndrome to evaluate whether residual MECP2 activity in neural stem cells (NSCs) induced the senescence phenomena that could affect stem cell function. Our study clearly demonstrated that the reduced expression of MECP2 is connected with an increase in senescence, an impairment in proliferation capacity, and an accumulation of unrepaired DNA foci. Mecp2 +/- NSCs did not cope with genotoxic stress in the same way as the control cells did. Indeed, after treatment with different DNA-damaging agents, the NSCs from mice with mutated Mecp2 accumulated more DNA damage foci (γ-H2AX+) and were more prone to cell death than the controls. Senescence in Mecp2 +/- NSCs decreased the number of stem cells and progenitors and gave rise to a high percentage of cells that expressed neither stem/progenitor nor differentiation markers. These cells could be senescent and dysfunctional.


Conflict of interest statement

The authors declare that they have no conflict of interest.

Figures

Fig. 1
Fig. 1. Cell growth, senescence, and apoptosis assays on Mecp2+/− and control NSCs.
a Senescence evaluation was performed with the MUG assay. The data are expressed as arbitrary units (±SD, n = 5 biological replicates, **p < 0.01). b Cell cycle analysis. The picture shows the cell cycle profiles of mutated and control NSCs (±SD, n = 5 biological replicates, *p < 0.05, **p < 0.01). c Annexin V assay to detect apoptotic cells. Representative photomicrographs of apoptotic cells stained with Annexin V (green). Nuclei were counterstained with Hoechst 33342 (blue). Graph shows mean expression values in Mecp2+/− and control samples (±SD, n = 5 biological replicates). d Cell proliferation was determined with a Quick Cell Proliferation Assay Kit II. Cells were seeded in 96-well culture plates. At 2, 3, 4, 5, and 8 days post plating, the cells were collected and counted (±SD, n = 5 biological replicates, *p < 0.05, **p < 0.01)
Fig. 2
Fig. 2. Western blot analysis of cell cycle-related pathways and autophagic flux.
a The picture shows the expression levels of RB1, P16, P53, and P21 in Mecp2+/− and control samples. For every protein, three biological replicates are shown. GAPDH was used as a loading control. The graph shows mean expression levels (±SD, n = 5 biological replicates, *p < 0.05, **p < 0.01). b Western blot detection of LC3-I and LC3-II in Mecp2+/− and control NSCs. The cells were grown as floating neurospheres and then harvested for western blot analysis. The detection of autophagic flux was performed by treating cultures with 100 nM of Bafilomycin A1, an inhibitor of lysosomal degradation, or with PBS. The LC3-I and II band intensities were normalized with GAPDH. The picture illustrates a representative western blot we analyzed to determine the autophagic flux. Autophagic flux (AF) for LC3-II was calculated as follows: Mecp2+/− NSC AF=(Mecp2+/− sample in Bafylomycin A1)−(Mecp2+/− sample in PBS), Control NSC AF=(Control sample in Bafylomycin A1)−(Control sample in PBS). The change in autophagic flux (ΔAF) between Mecp2+/− and the control NSCs was calculated as ΔAF=Mecp2+/− NSC AF− Control NSC AF. The graph shows AF changes in Mecp2+/− NSCs compared with the control cultures. The data in the control were set as equal to 1 (n = 5 biological replicates; **p < 0.01)
Fig. 3
Fig. 3. DNA damage, senescence, apoptosis, and necrosis.
a Photos show the merging of cells stained with anti-H2AX (green) and DAPI (blue). Representative microscopic fields are depicted. The column scatter plot indicates the degree of H2AX phosphorylation that was determined by counting the number of γ-H2AX immunofluorescent foci per cell. The foci number was determined for 200 cells. Each dot represents a single cell. Horizontal bars indicate the mean value for each category (Mecp2+/− and control NSCs; n = 5 biological replicates; *p < 0.05). b, c, d The DNA damage levels following genotoxic treatments with hydrogen peroxide, doxorubicin, and UV irradiation, respectively. For every condition, the degree of DNA damage was determined by counting γ-H2AX foci. Changes in the level of senescence, apoptosis, and necrosis in Mepc2+/− NSCs were compared with the control cultures. The data are expressed in fold change (n = 5 biological replicates; *p < 0.05, **p < 0.01)
Fig. 4
Fig. 4. NSC differentiation.
Representative photomicrographs of Mecp2+/− and control NSCs differentiated for 3 days onto poly-l-ornithine-coated plates in medium without growth factors. The cells were stained for SOX2, Nestin, MAP2, GFAP, and O1. The nuclei were counterstained with DAPI
Fig. 5
Fig. 5. NSC differentiation and senescence in cells expressing wild-type and mutated Mecp2.
Cells expressing mutated or wild-type Mecp2 were identified by using the anti-MECP2 primary antibody. In Mecp2+/− samples, the MECP2 protein (red) was present in cells expressing the wild-type allele and was undetectable in those expressing the mutated allele. The picture shows representative photomicrographs of Mecp2+/− and control NSCs differentiated for 3 days onto poly-l-ornithine-coated plates in medium without growth factors. The cells were stained in green for SOX2, Nestin, MAP2, GFAP, and O1. The nuclei were counterstained with DAPI (blue). Every microscopic field was also analyzed under a bright-light field to detect senescent-associated β-galactosidase. The senescent cells show a dark gray staining. In the table are indicated the percentages of stem cells (SOX2+), early progenitors (Nestin+), neurons (MAP2+), astrocytes (GFAP+), and oligodendrocytes (O1+); the (−) symbol indicates the cells that were negative for all the analyzed markers. In the Mecp2+/− samples, indicated as RTT, the percentage of progenitors and differentiated cells was evaluated in cells expressing either the normal or the mutated allele (n = 5 biological replicates; *p < 0.05, **p < 0.01 with respect to samples from wild-type animals)

References

    1. Ozkul Y, Galderisi U. The impact of epigenetics on mesenchymal stem cell biology. J. Cell. Physiol. 2016;231:2393–2401. doi: 10.1002/jcp.25371. - DOI - PubMed
    1. Di Bernardo G, Cipollaro M, Galderisi U. Chromatin modification and senescence. Curr. Pharm. Des. 2012;18:1686–1693. doi: 10.2174/138161212799859693. - DOI - PubMed
    1. Antequera F. Structure, function and evolution of CpG island promoters. Cell. Mol. Life. Sci. 2003;60:1647–1658. doi: 10.1007/s00018-003-3088-6. - DOI - PMC - PubMed
    1. Fuks F, et al. The methyl-CpG-binding protein MeCP2 links DNA methylation to histone methylation. J. Biol. Chem. 2003;278:4035–4040. doi: 10.1074/jbc.M210256200. - DOI - PubMed
    1. Kimura H, Shiota K. Methyl-CpG-binding protein, MeCP2, is a target molecule for maintenance DNA methyltransferase Dnmt1. J. Biol. Chem. 2003;278:4806–4812. doi: 10.1074/jbc.M209923200. - DOI - PubMed

Publication types