. 2018 Mar 21;9(1):1176.
doi: 10.1038/s41467-018-03573-6.

Integrative proteomics in prostate cancer uncovers robustness against genomic and transcriptomic aberrations during disease progression

Affiliations

Integrative proteomics in prostate cancer uncovers robustness against genomic and transcriptomic aberrations during disease progression

Leena Latonen et al. Nat Commun. .

Abstract

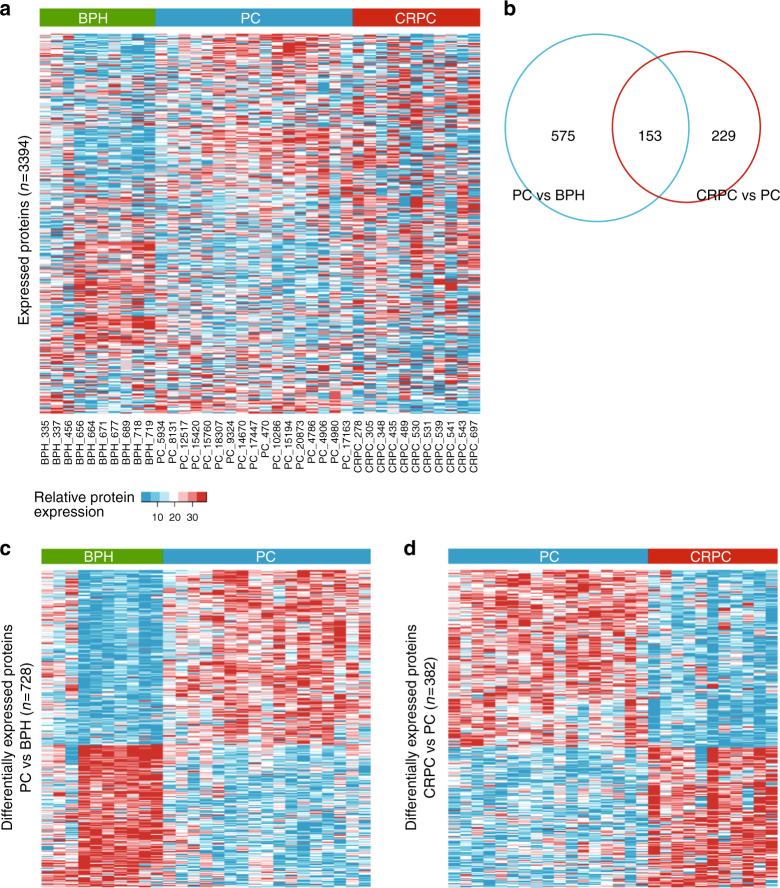
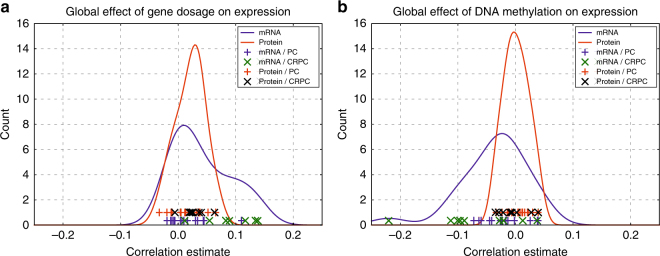
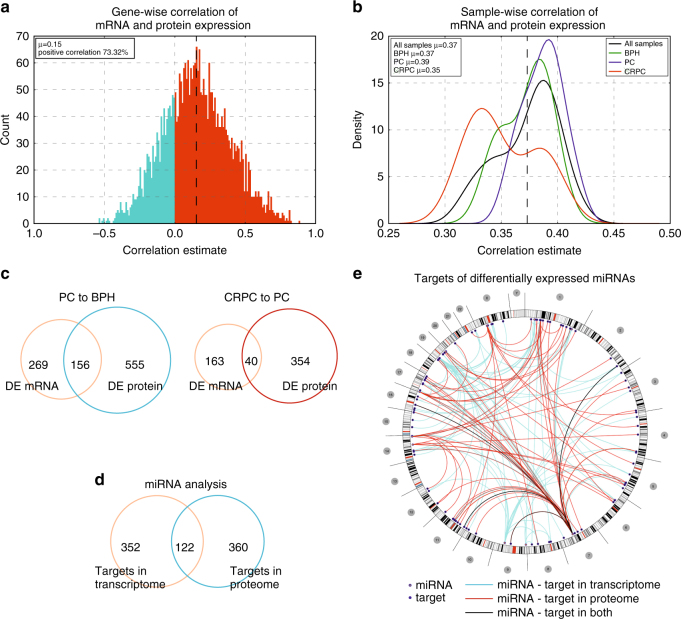
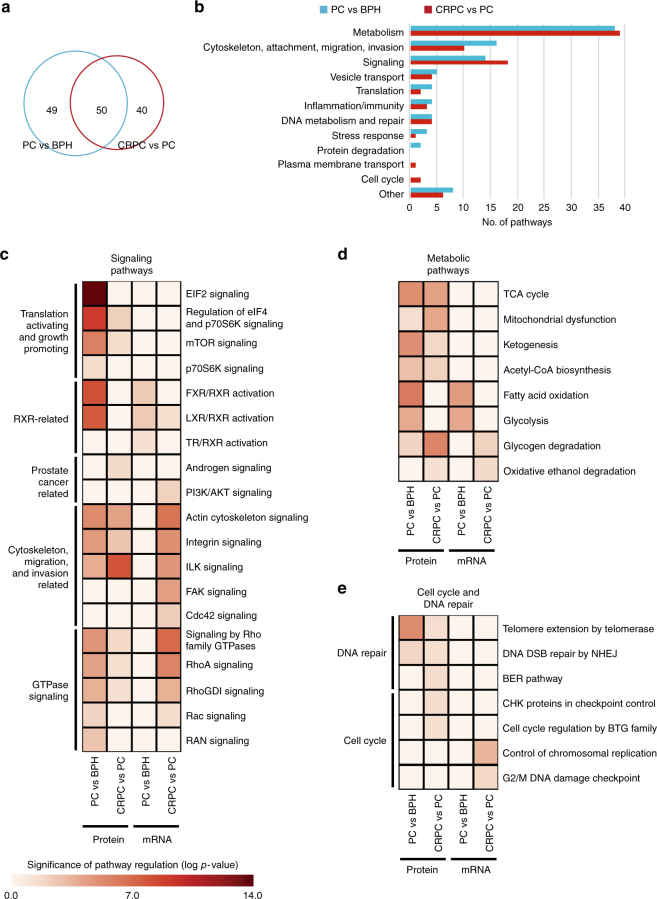
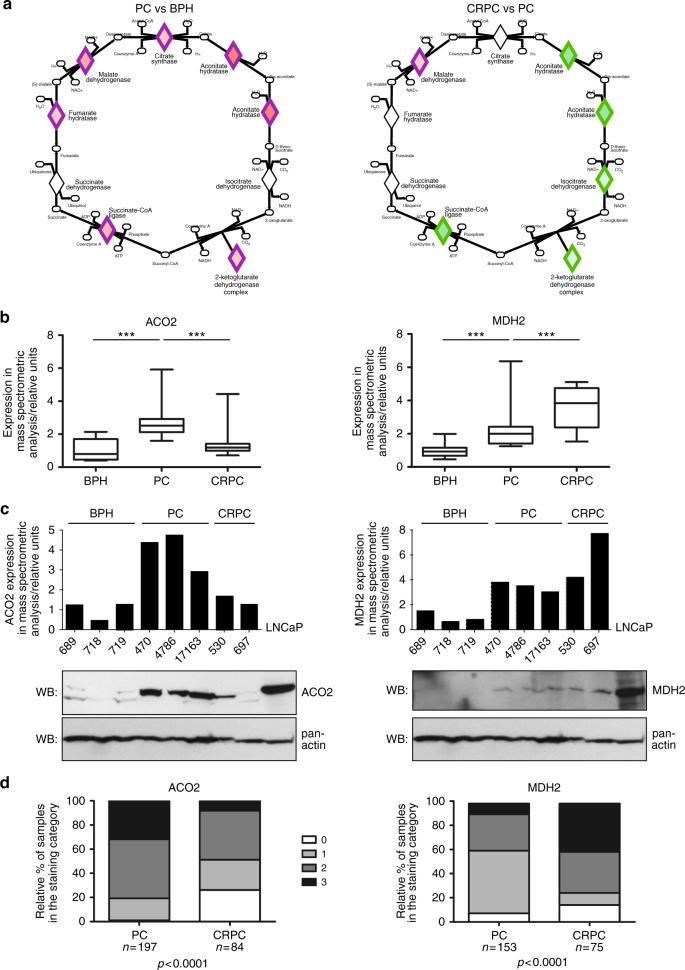
To understand functional consequences of genetic and transcriptional aberrations in prostate cancer, the proteomic changes during disease formation and progression need to be revealed. Here we report high-throughput mass spectrometry on clinical tissue samples of benign prostatic hyperplasia (BPH), untreated primary prostate cancer (PC) and castration resistant prostate cancer (CRPC). Each sample group shows a distinct protein profile. By integrative analysis we show that, especially in CRPC, gene copy number, DNA methylation, and RNA expression levels do not reliably predict proteomic changes. Instead, we uncover previously unrecognized molecular and pathway events, for example, several miRNA target correlations present at protein but not at mRNA level. Notably, we identify two metabolic shifts in the citric acid cycle (TCA cycle) during prostate cancer development and progression. Our proteogenomic analysis uncovers robustness against genomic and transcriptomic aberrations during prostate cancer progression, and significantly extends understanding of prostate cancer disease mechanisms.


Conflict of interest statement

The authors declare no competing interests.

Figures

Fig. 1
Fig. 1
Proteomic analysis reveals distinct protein expression patterns in PC and CRPC. a Heat map of all protein expressions identified and quantified by mass spectrometry in the proteomic analysis of BPH and prostate cancer samples (PC and CRPC). Each column of heat map represents a patient sample and each row represents a specific protein (n = 3394). b Venn diagram showing the numbers of differentially expressed proteins in PC vs BPH and CRPC vs PC comparisons. Only a minority of the differentially expressed proteins overlap between the comparisons. c, d Heat maps of the differentially expressed proteins in b show clearly distinctive patterns of protein expression between disease groups. PC compared to BPH samples (n = 728) is shown in c, and CRPC compared to PC samples (n = 382) is shown in d. Color key of relative expression in a applies also to c and d
Fig. 2
Fig. 2
Global expression changes associated with gene copy number and DNA methylation are visible at the transcriptomic but not at proteomic level. a Correlation distributions of mRNA and protein expression with gene copy number. Lines represent effects in all analyzed genes in all samples, and show that gene dosage has higher positive correlation with mRNA expression than protein expression in prostate cancer on a global scale. Symbols on the bottom of the graph represent individual samples, and show how most of the CRPC samples have a higher positive correlation compared to PC samples at the mRNA level, as at the protein level no such difference between the disease groups is observed. b Correlation distributions of mRNA and protein expression with DNA methylation. Lines represent effects in all analyzed genes in all samples, and show that DNA methylation has higher negative correlation with mRNA expression than protein expression in prostate cancer on a global scale. Symbols on the bottom of the graph represent individual samples, and show how most of the CRPC samples have a decreased correlation compared to PC samples at the mRNA level, as at the protein level no such difference between the disease groups is observed
Fig. 3
Fig. 3
Transcriptomic and proteomic data show distinct patterns of expression at the RNA and protein level in prostate cancer. a Correlation between mRNA and protein expression of individual genes. The graph shows correlations of all genes identified in proteomic analysis in all samples used in this study. Most of the genes (>73%) show positive correlation between expression of their mRNA and protein. μ is the mean of the correlations. b Disease group-wise correlation between mRNA and protein expression of the genes identified in the proteomic analysis shows that in CRPC there is a decreased correlation between mRNA–protein expression pairs compared to primary PC. Compared to all samples (black line) and BPH (green line), the PC samples (blue line) have a higher correlation between their mRNA-protein expression pairs, while CRPC samples (red line) have a lower correlation. µ is the mean of the correlations. c Venn diagram showing the numbers differentially expressed (DE) genes in PC vs BPH and CRPC vs PC comparisons identified based on mRNA or protein expression. The numbers of overlapping genes show that only a minority of the differentially expressed genes show expression changes in both mRNA and protein levels. d Venn diagram showing the numbers of genes that are negatively correlating with a targeting miRNA based on their expression at the mRNA or protein level. Only a minority of the miRNA targets are identified both at the mRNA and protein level, indicating that correlations at the protein level help to identify mostly a different pool of miRNA targets than correlations at the mRNA level. e Circos plot depicting genomic locations of miRNAs and their targets that are both negatively correlating at expression, as well as differentially expressed during prostate cancer progression (CRPC vs PC samples). Outer ring indicates chromosomes and cytobands, with chromosome numbers in the gray circles. Each line in the center maps a prostate cancer-related miRNA-target pair indicated through transcriptomic (blue lines), proteomic (red lines), or both (black lines) analyses. The blue circles mark the genomic location of the miRNAs, and the solid blue dots mark the targets
Fig. 4
Fig. 4
Proteomic analysis identifies novel pathways as regulated in PC and CRPC. a Venn diagram showing numbers of differentially regulated pathways according to Ingenuity Pathway Analysis in PC vs BPH and CRPC vs PC comparisons. Despite partial overlap, the different disease states have a significant number of pathways specifically regulated. b Differentially regulated pathways in a according to pathway types. Metabolism is the largest group in both comparisons, with roughly a similar number of pathways differentially regulated. Numbers of most of the other pathway types that are differentially regulated between the disease states vary. ce Examples of signaling pathways found to be differentially regulated according to proteomics (protein) or transcriptomics (mRNA) data in PC vs BPH and CRPC vs PC comparisons. c Examples of signaling pathways groups identified as regulated according to proteomic data. Especially translation activating, growth promoting pathways are identified as regulated solely based on proteomic data. RXR-related pathways are identified better by proteomics than transcriptomics to be regulated in PC. Pathways related to cytoskeleton, migration, and invasion, as well as GTPase signaling pathways are identified to be regulated in PC solely by proteomics, although in CRPC they are better identified as regulated by transcriptomics. d Metabolic pathways differentially identified as regulated based on proteomic and transcriptomic data include pathways identified as regulated in both PC and CRPC solely based on proteomics (TCA cycle, mitochondrial dysfunction, ketogenesis, acetyl-CoA biosynthesis), and pathways that are equally identified by proteomics and transcriptomics, but are specific for PC (fatty acid oxidation, glycolysis) or CRPC (glycogen degradation, oxidative ethanol degradation). e While DNA repair pathways regulated in PC and CRPC were identified based on proteomics only, the regulated cell cycle pathways were altered in CRPC and identified based on either proteomic or transcriptomic data. The color key below panel c applies to panels c, d, and e
Fig. 5
Fig. 5
TCA cycle is differentially regulated during prostate cancer progression. a A schematic view of the TCA cycle protein expression changes in PC vs BPH and CRPC vs PC comparisons according to the Ingenuity Pathway Analysis. Differential expression of TCA enzymes (diamonds) are highlighted in green (downregulation) and red (upregulation). As mostly the same enzymes are involved in both PC and CRPC, the primary mode of expression change is upregulation in PC and downregulation in CRPC. b Examples of a typical (ACO2) and a unique (MDH2) TCA protein expression patterns as identified by mass spectrometry proteomics. ACO2 is upregulated in PC compared to BPH, and gets downregulated in CRPC compared to PC. MDH2 protein expression levels increase in PC compared to BPH, and continue to increase in CRPC. Boxplots show interquartiles with mean values, whiskers represent minimum and maximum values. ***p-value < 0.001 (Mann–Whitney test). c ACO2 and MDH2 protein expression patterns verified in a subset of BPH, PC, and CRPC samples by western blotting. ACO2 and MDH2 protein expression according to the proteomic mass spectrometry analysis (upper panel bar graph) and in corresponding samples according to western blotting (WB; lower panels). Pan-actin is used as a loading control. d Change in ACO2 and MDH2 protein expression patterns during progression of prostate cancer verified by immunohistochemistry. Immunohistochemical analysis in clinical tumor samples of PC and CRPC show statistically significantly decreased ACO2 and increased MDH2 staining intensity in CRPC compared to PC and (Chi squared test; 0 = no staining, 1 = weak staining, 2 = intermediate staining, 3 = strong staining)

Comment in

  • Controlling mutational chaos.
    Thoma C. Thoma C. Nat Rev Urol. 2018 Jun;15(6):335. doi: 10.1038/s41585-018-0021-1. Nat Rev Urol. 2018. PMID: 29743669 No abstract available.

Similar articles

Cited by

References

    1. Jemal A, et al. Global cancer statistics. CA Cancer J. Clin. 2011;61:69–90. doi: 10.3322/caac.20107. - DOI - PubMed
    1. Wong YNS, Ferraldeschi R, Attard G, de Bono J. Evolution of androgen receptor targeted therapy for advanced prostate cancer. Nat. Rev. Clin. Oncol. 2014;11:365–376. doi: 10.1038/nrclinonc.2014.72. - DOI - PubMed
    1. Taylor BS, et al. Integrative genomic profiling of human prostate cancer. Cancer Cell. 2010;18:11–22. doi: 10.1016/j.ccr.2010.05.026. - DOI - PMC - PubMed
    1. Barbieri CE, et al. Exome sequencing identifies recurrent SPOP, FOXA1 and MED12 mutations in prostate cancer. Nat. Genet. 2012;44:685–689. doi: 10.1038/ng.2279. - DOI - PMC - PubMed
    1. Grasso CS, et al. The mutational landscape of lethal castration-resistant prostate cancer. Nature. 2012;487:239–243. doi: 10.1038/nature11125. - DOI - PMC - PubMed

Publication types

MeSH terms