. 2018 Mar 21;9(1):1167.
doi: 10.1038/s41467-018-03569-2.

A spliced latency-associated VZV transcript maps antisense to the viral transactivator gene 61

Affiliations

A spliced latency-associated VZV transcript maps antisense to the viral transactivator gene 61

Daniel P Depledge et al. Nat Commun. .

Abstract

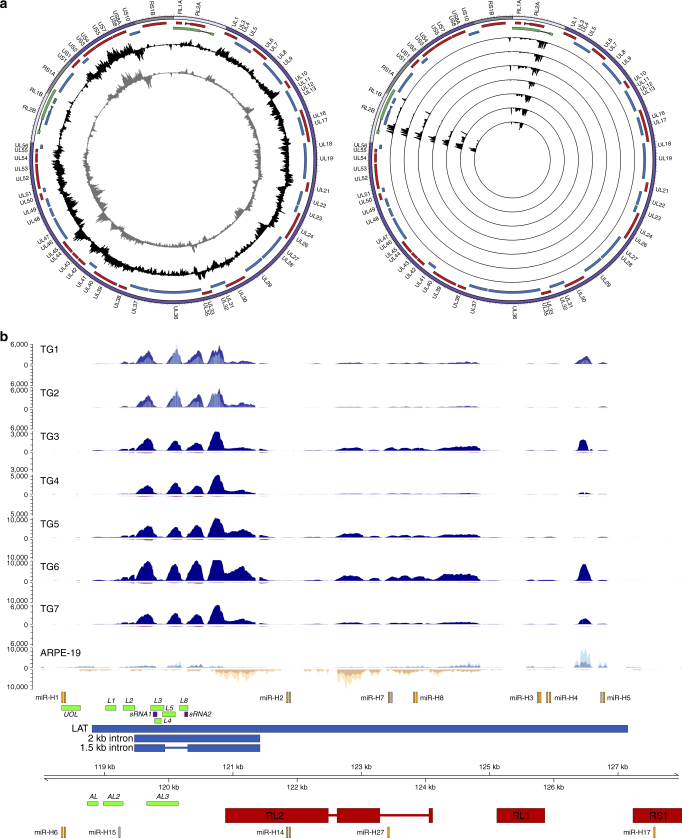
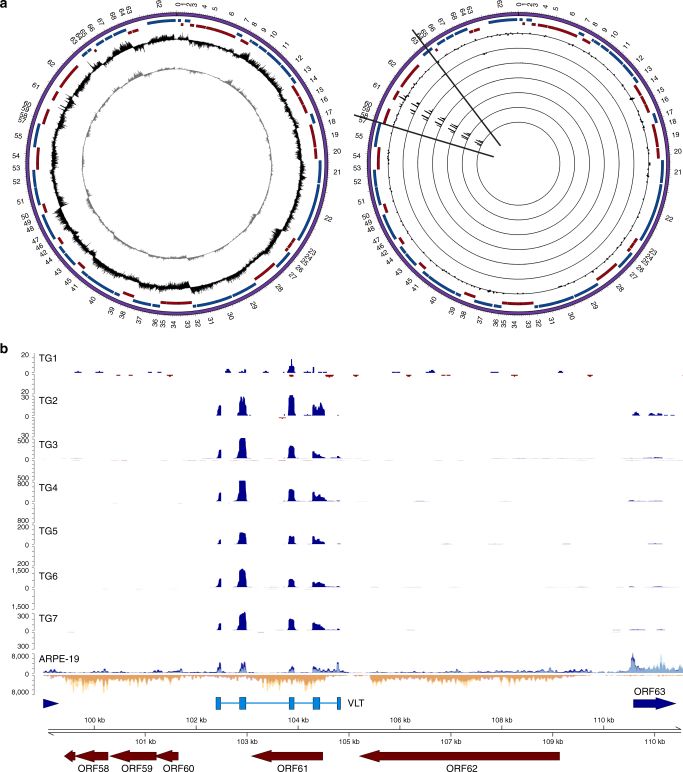
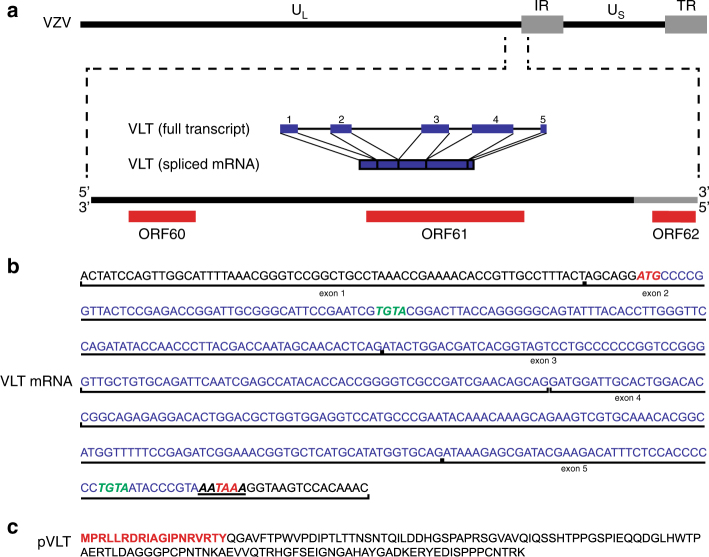
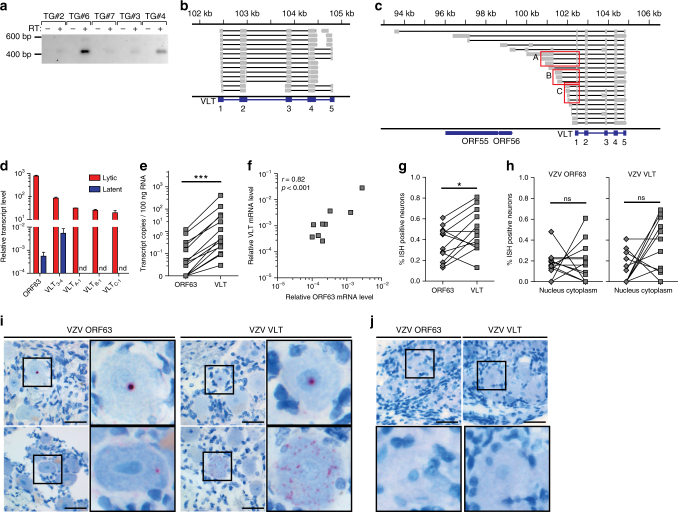
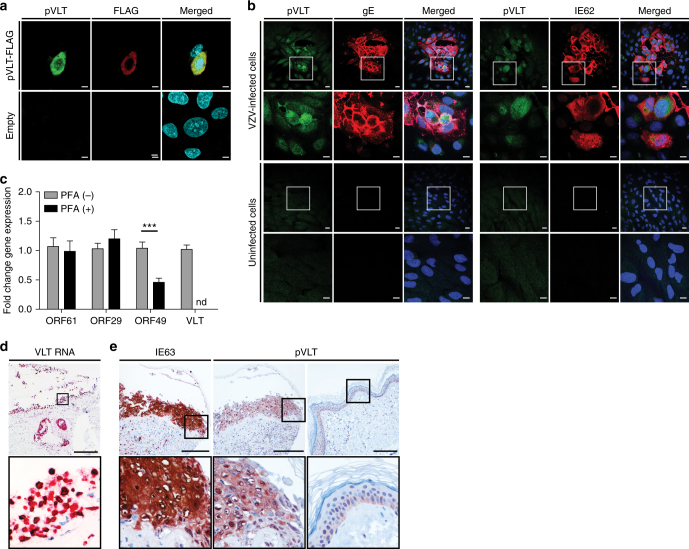
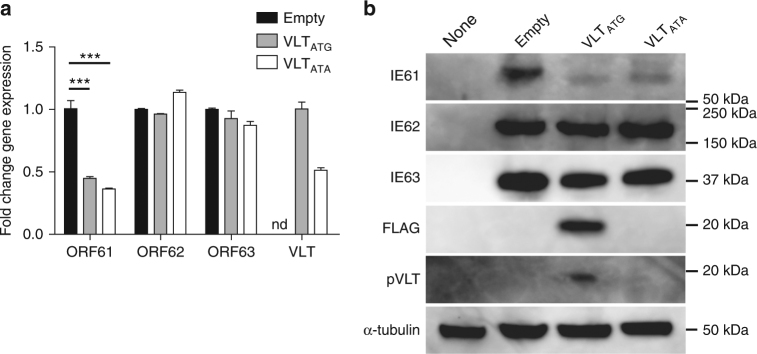
Varicella-zoster virus (VZV), an alphaherpesvirus, establishes lifelong latent infection in the neurons of >90% humans worldwide, reactivating in one-third to cause shingles, debilitating pain and stroke. How VZV maintains latency remains unclear. Here, using ultra-deep virus-enriched RNA sequencing of latently infected human trigeminal ganglia (TG), we demonstrate the consistent expression of a spliced VZV mRNA, antisense to VZV open reading frame 61 (ORF61). The spliced VZV latency-associated transcript (VLT) is expressed in human TG neurons and encodes a protein with late kinetics in productively infected cells in vitro and in shingles skin lesions. Whereas multiple alternatively spliced VLT isoforms (VLTly) are expressed during lytic infection, a single unique VLT isoform, which specifically suppresses ORF61 gene expression in co-transfected cells, predominates in latently VZV-infected human TG. The discovery of VLT links VZV with the other better characterized human and animal neurotropic alphaherpesviruses and provides insights into VZV latency.


Conflict of interest statement

The authors declare no competing interests.

Figures

Fig. 1
Fig. 1
HSV-1 transcriptome profile during lytic and latent infection. Strand-specific mRNA-seq of lytically HSV-1-infected ARPE-19 cells and seven latently HSV-1-infected human trigeminal ganglia (TG) (Supplementary Table 1). a Circos plots of the HSV-1 genome [purple band; sense and antisense open reading frames (ORFs) indicated as blue and red blocks, respectively], the latency associated transcripts (LATs) indicated as green blocks, with internal tracks revealing the lytic (left) and latent (right) transcriptomes using unenriched (grey tracks) and HSV-1-enriched (black tracks) libraries. Lytic transcriptomes were profiled using HSV-1-infected ARPE-19 cells. Latent HSV-1 transcriptomes are profiled from seven TGs, with each track depicting a single specimen. Peaks facing outward from the centre indicate reads mapping to the sense strand, while peaks facing inward originate from the antisense strand. The y axis is scaled to maximum read depth per library in all cases. b Linear representation of the HSV-1 LAT genomic region (green blocks in a), with blue and yellow tracks depicting HSV-1-enriched mRNA-Seq reads originating from the sense and antisense strand, respectively. Unenriched mRNA-Seq tracks for ARPE-19 cells, and TGs 1 and 2, are superimposed and shown in light blue (sense) or yellow (antisense), with overlapping regions in medium-blue and orange, respectively. HSV-1 genome coordinates are shown the HSV-1 reference strain 17 (NC_001806.2); Previously described HSV-1 ORFs within this locus (red boxes), miRNAs (orange blocks), LAT-encoded ORFs (green blocks), LAT-encoded small RNAs (dark red blocks) and LAT (blue boxes) are scaled representatively. . Paired-end read data sets were generated with read lengths of 2 × 34 bp (ARPE-19) or 2 × 76 bp (TG1 and TG2) or 2 × 151 bp (TG3–TG7)
Fig. 2
Fig. 2
VZV transcriptome profile during lytic and latent infection. Strand-specific mRNA-seq of lytically VZV-infected ARPE-19 cells and seven latently VZV-infected human trigeminal ganglia (TG) (Supplementary Table 1). a Circos plots of the VZV genome [purple band; sense and antisense open reading frames (ORFs) indicated as blue and red blocks, respectively], with internal tracks revealing the lytic (left) and latent (right) transcriptomes using unenriched (grey track, left panel) and VZV-enriched (black tracks, left and right panels) libraries. Right panel: latent VZV transcriptome of seven TG, with each track depicting a single specimen. Peaks facing outward from the centre indicate reads mapping to the sense strand, while peaks facing inward originate from the antisense strand. The y axis is scaled to maximum read depth per library in all cases. b Linear representation of the varicella latency-associated transcript (VLT) genomic region (black lines in a), with blue and yellow tracks depicting VZV-enriched mRNA-Seq reads originating from the sense and antisense strands, respectively. Unenriched mRNA-Seq tracks for ARPE-19 cells, and TGs 1 and 2, are superimposed and shown in light blue (sense) or yellow (antisense), with overlapping regions in medium-blue and orange, respectively. No VZV-mapping reads were obtained from unenriched sequence data sets generated from TGs 1 and 2. VZV genome coordinates are shown the VZV reference strain Dumas (NC_001348.1); blue and red arrows indicate previously described VZV ORFs, and light blue boxes indicate the five VLT exons. Paired-end read data sets were generated with read lengths of 2 × 34 bp (ARPE-19) or 2 × 76 bp (TG1 and TG2) or 2 × 151 bp (TG3–TG7)
Fig. 3
Fig. 3
The genomic locus encoding the VZV latency-associated transcript (VLT). a Schematic diagram showing the location and structure of the five VLT exons (blue blocks) and introns (blue lines) within the genomic region 101,000–106,000 (coordinates refer to VZV reference strain Dumas; NC_001348.1) (Supplementary Table 3). b The VLT mRNA sequence including the 5’ untranslated region; start and stop codons are highlighted in red italic, while the cleavage factor I (CFI)-binding motifs are highlighted in green italic and the canonical polyadenylation signal site (AATAAA) is underlined. Location and boundaries of VLT exons are indicated by vertical black lines. c The fully translated VLT protein (pVLT), with the sequence of peptide (red) used to produce rabbit polyclonal anti-pVLT antibody
Fig. 4
Fig. 4
Prevalence of VLT and ORF63 transcript in human TG. a PCR amplification of cDNA (n = 5 TGs, Supplementary Table 1), synthesized in the presence (+) or absence (−) of reverse transcriptase. Sanger sequencing of all five purified PCR products yielded identical sequences corresponding to VLT (Fig. 3b). b Integrative Genomics Viewer (IGV) screenshot showing representative RNA-Seq data from a single TG. Paired-end reads are shown as fragments mapped across the VLT locus. Grey boxes (exons) connected by black lines (introns) indicate individual read pairs with distinct read-pairs separated by white space. Each fragment spans between 2 and 5 exons and there was no evidence of additional upstream exons. c In lytically VZV-infected MeWo cells, Sanger sequencing of amplicons generated through rapid amplification of cDNA ends revealed multiple VLTly isoforms, visualized using IGV. Sequencing of 29 clones identified the three most abundant VLTly isoform groups (red boxes) A (35%), B (19%) and C (15%). Note that the specific VLT isoform observed in latently infected TG was not observed among VLTly isoforms. d Quantification of ORF63 transcript and VLT isoforms in lytically VZV-infected ARPE-19 cells (red; n = 3) and latently VZV-infected TG (blue; n = 19 TG), using primers/probes spanning VLT splice junctions between exons 3→4, A→1, B→1 and C→1 (Fig. 4c and Supplementary Table 5). Data represent mean (±SEM) relative transcript levels normalized to β-actin RNA. nd not detected. e Levels of paired ORF63 transcript and VLT (primers/probe spanning exon 2→3) in the same VZVPOS TG (VZVPOS; n = 15) determined by RT-qPCR. ***p < 0.001; Wilcoxon signed rank test. f Correlations (Spearman) between relative ORF63 transcript and VLT levels in VZVPOS TG (n = 15), as determined by RT-qPCR. gj In situ hybridization (ISH; red signal) analysis of ORF63 RNA and VLT in latently VZV-infected TG (n = 12). g Frequency of neurons positive for ORF63 RNA and VLT in consecutive TG sections of the same donor. *p < 0.05; paired Student’s t-test. h Nuclear and cytoplasmic ORF63 RNA and VLT expression in consecutive TG sections from individual donors. ns not significant; paired Student's t-test. i, j Representative ISH images of VZVPOS TG sections (i) and two VZV naive human fetal dorsal root ganglia (j). Nuclei were stained with haematoxylin. Magnification: ×400 (with 3× digital zoom for insets). Bars = 50 µm
Fig. 5
Fig. 5
Expression of VLT protein in vitro and in situ. a Representative confocal microscopic image of ARPE-19 cells at 48 h post-transfection with C-terminal FLAG-tagged VLT (pVLT-FLAG) expression plasmid or empty control plasmid (empty). pVLT-FLAG was detected with antibodies directed to FLAG (red) and VLT protein (pVLT; green). Magnification: ×1000 and ×2 digital zoom. Bars = 5 µm. b Representative confocal microscopic images of uninfected and VZV strain EMC1-infected ARPE-19 cells at 2 days post-infection, stained for both pVLT (green) and VZV glycoprotein E (gE; red) (left panel) or pVLT (green) combined with VZV ORF62 protein (IE62; red) (right panel). Magnification: ×200, with area indicated by the white box shown at ×600. Bars = 20 µm (×200) and 10 µm (×600). In a, b, nuclei were stained with Hoechst 33342 (cyan) and images are representative of results from four independent experiments. c RT-qPCR quantitation of VZV ORF61, ORF29 and ORF49 transcript and VLT levels in VZV pOka-infected ARPE-19 cells cultured with (PFA+) and without phosphonoformic acid (PFA−) for 24 h. Data represent mean (±SEM) fold-change in gene expression, using the respective ‘PFA−' value as a calibrator, from four independent experiments. ***p < 0.001; Wilcoxon signed rank test. d Detection of VLT (red) in a human herpes zoster (HZ) skin lesion by in situ hybridization. Magnification: ×100. Inset: ×400 and 2× digital zoom. Bar = 200 µm. e Consecutive HZ skin sections stained immunohistochemically for ORF63 protein (IE63; brown) and pVLT (brown) (left and middle panels) and sections from unaffected control skin stained for pVLT (right panel). Magnification: ×200. Inset: ×400. Bars = 100 µm. Images in d, e are representative of five HZ skin biopsies stained
Fig. 6
Fig. 6
Selective repression of VZV ORF61 gene expression by VLT in co-transfected cells. ARPE-19 cells were transfected with plasmids encoding FLAG-tagged VLT (VLTATG), mutated VLT in which the ATG start codon was replaced by ATA sequence (VLTATA) or empty control plasmid (empty) in combination with plasmids encoding ORF61, ORF62 and ORF63. a Analysis of VZV ORF61, ORF62 and ORF63 and human β-actin transcript by RT-qPCR. Data represent mean (±SEM) fold-change in gene expression using the empty vector to calibrate ORF61, ORF62 and ORF63 or using VLTATA to calibrate VLTATG. Data are from two independent experiments performed in duplicate. nd not detected. ***p < 0.001; one-way ANOVA with Bonferroni’s correction for multiple comparisons. b Western blot analysis using antibodies directed to proteins encoded by VZV ORF61 (IE61), ORF62 (IE62), ORF63 (IE63), VLT (pVLT) and FLAG-tagged pVLT and α-tubulin. None, untransfected ARPE-19 cells. Images are representative of four independent experiments

Similar articles

Cited by

References

    1. Kennedy PGE, Rovnak J, Badani H, Cohrs RJ. A comparison of herpes simplex virus type 1 and varicella-zoster virus latency and reactivation. J. Gen. Virol. 2015;96:1581–1602. doi: 10.1099/vir.0.000128. - DOI - PMC - PubMed
    1. Priola SA, Stevens JG. The 5′ and 3′ limits of transcription in the pseudorabies virus latency associated transcription unit. Virology. 1991;182:852–856. doi: 10.1016/0042-6822(91)90628-O. - DOI - PubMed
    1. Cheung AK. Cloning of the latency gene and the early protein 0 gene of pseudorabies virus. J. Virol. 1991;65:5260–5271. - PMC - PubMed
    1. Rock DL, Beam SL, Mayfield JE. Mapping bovine herpesvirus type 1 latency-related RNA in trigeminal ganglia of latently infected rabbits. J. Virol. 1987;61:3827–3831. - PMC - PubMed
    1. Bratanich AC, Hanson ND, Jones CJ. The latency-related gene of bovine herpesvirus 1 inhibits the activity of immediate-early transcription unit 1. Virology. 1992;191:988–991. doi: 10.1016/0042-6822(92)90278-W. - DOI - PubMed

Publication types

MeSH terms