. 2018 Mar 21;9(1):1177.
doi: 10.1038/s41467-018-03597-y.

Dynamical origins of heat capacity changes in enzyme-catalysed reactions

Affiliations

Dynamical origins of heat capacity changes in enzyme-catalysed reactions

Marc W van der Kamp et al. Nat Commun. .

Abstract

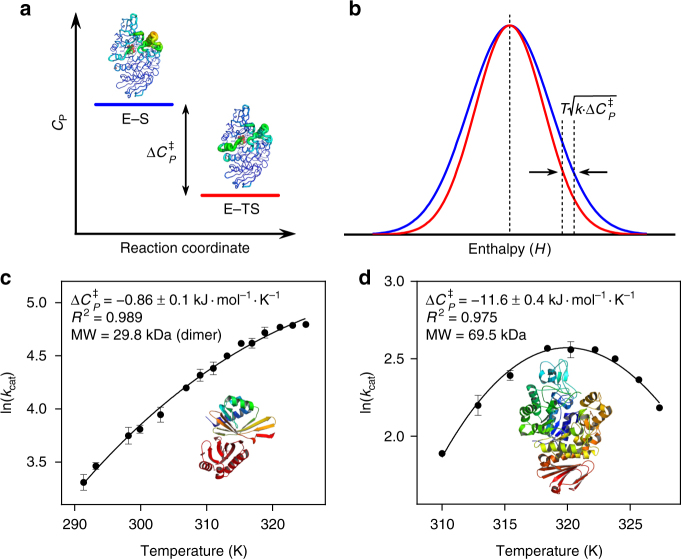
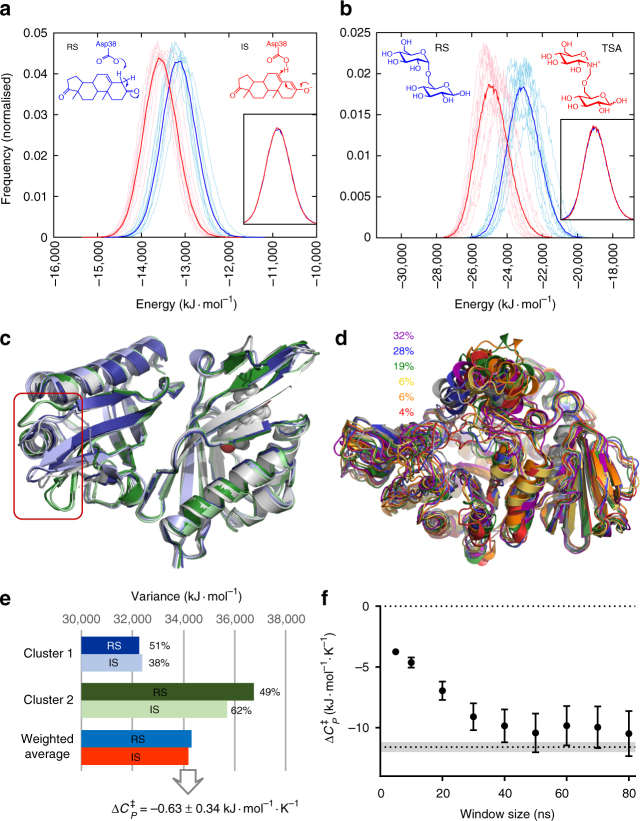
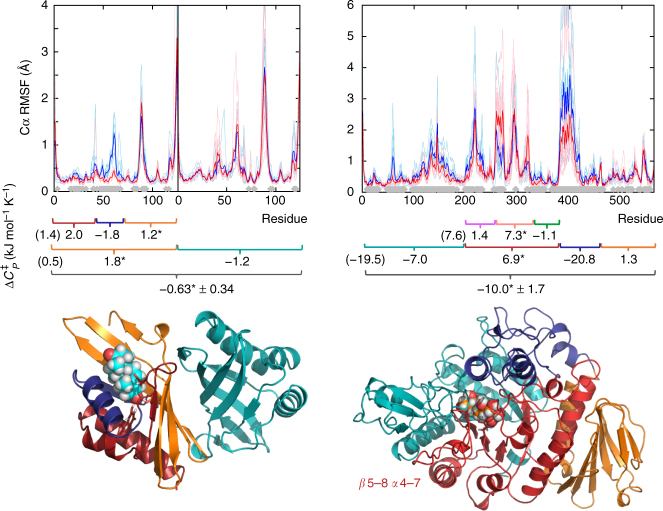
Heat capacity changes are emerging as essential for explaining the temperature dependence of enzyme-catalysed reaction rates. This has important implications for enzyme kinetics, thermoadaptation and evolution, but the physical basis of these heat capacity changes is unknown. Here we show by a combination of experiment and simulation, for two quite distinct enzymes (dimeric ketosteroid isomerase and monomeric alpha-glucosidase), that the activation heat capacity change for the catalysed reaction can be predicted through atomistic molecular dynamics simulations. The simulations reveal subtle and surprising underlying dynamical changes: tightening of loops around the active site is observed, along with changes in energetic fluctuations across the whole enzyme including important contributions from oligomeric neighbours and domains distal to the active site. This has general implications for understanding enzyme catalysis and demonstrating a direct connection between functionally important microscopic dynamics and macroscopically measurable quantities.


Conflict of interest statement

The authors declare no competing interests.

Figures

Fig. 1
Fig. 1
Basis of a negative ΔCP and its determination through experiment or simulation. a Conceptual depiction of a difference in CP between the enzyme–substrate (E–S) and enzyme–transition state (E–TS) complexes along a reaction, resulting in a negative ΔCP. b Conceptual depiction of differences in enthalpy distribution at the E–TS (red) and the E–S states (blue). Arrows indicate the inflection points (at μ + σ), and the difference defines ΔCP between the two states according to the formula given (see Eq. 1). cd Experimentally determined ΔCP values (kJ mol−1 K−1 ± SE) for the temperature-dependent rates of KSI (c) and MalL (d). The data are fit with MMRT (see Methods). Error bars, where visible, represent the standard deviation of three replicates. Structures of KSI and MalL are drawn to scale
Fig. 2
Fig. 2
Sampling and ΔCP calculation in simulations. a-b Histograms of energies from 50 to 500 ns MD simulations for KSI (a) and MalL (b). Thin lines are individual runs, thick lines are the average of ten runs. Insets show overlay of histograms for both states, and the structures indicate the species simulated (RS reactant state, IS intermediate state, TSA transition state analogue). c Representative structures for the two distinct conformational clusters present in the KSI simulations of both states (reactant state in blue and green, intermediate state in pale blue and green, starting structure in light grey). Box highlights the region with structural differences. d Representative structures for the six main conformational clusters in MalL reactant state simulations and their occupancies (starting structure in light grey). e Variance in energies for the two clusters identified in the KSI simulations, with cluster occupancies (in %) and weighted average variance for both states. f Convergence with moving average-window size of ΔCP values calculated for MalL, with value determined from experiment indicated by dotted line (with grey area indicating standard deviation). Error bars indicate the standard deviation of the calculated ΔCP values based on the cumulative standard deviation for each state, from 10 independent simulations
Fig. 3
Fig. 3
Structural fluctuations and partial heat capacity differences between reactant state and transition-state analogue complexes. Top: root-mean square fluctuations from 50–500 ns MD simulations for KSI (left) and MalL (right). Thin lines are individual runs, thick lines the average of ten runs. Residues for which the Cα RMSF difference between states are significant (p < 0.01 as determined by a two-sample t-test) are indicated by grey diamonds (full data in Supplementary Fig. 7). Middle: calculated partial ΔCP values for protein regions. Values including contribution from the ligand are indicated (*). Bottom: illustration of KSI (left) and MalL (right) coloured based on partial ΔCP regions from the middle pane. Standard deviations are indicated for the total ΔCP values; see Supplementary Table 5 for residue ranges and standard deviations for partial ΔCP values. Transition-state analogues are shown with space-filling spheres

Similar articles

Cited by

References

    1. Arrhenius S. Über die Reaktionsgeschwindigkeit bei der Inversion von Rohrzucker durch Säuren. Z. Phys. Chem. 1889;4:226–248.
    1. Eyring H. The activated complex in chemical reactions. J. Chem. Phys. 1935;3:107–115. doi: 10.1063/1.1749604. - DOI
    1. Thomas TM, Scopes RK. The effects of temperature on the kinetics and stability of mesophilic and thermophilic 3-phosphoglycerate kinases. Biochem. J. 1998;330:1087–1095. doi: 10.1042/bj3301087. - DOI - PMC - PubMed
    1. Daniel RM, Danson MJ. A new understanding of how temperature affects the catalytic activity of enzymes. Trends Biochem. Sci. 2010;35:584–591. doi: 10.1016/j.tibs.2010.05.001. - DOI - PubMed
    1. Buchanan CL, Connaris H, Danson MJ, Reeve CD, Hough DW. An extremely thermostable aldolase from Sulfolobus solfataricus with specificity for non-phosphorylated substrates. Biochem. J. 1999;3:563–570. doi: 10.1042/bj3430563. - DOI - PMC - PubMed

Publication types

MeSH terms

LinkOut - more resources