. 2018 Mar 21;8(1):4969.
doi: 10.1038/s41598-018-23300-x.

MFSD2B is a sphingosine 1-phosphate transporter in erythroid cells

Affiliations

MFSD2B is a sphingosine 1-phosphate transporter in erythroid cells

Naoki Kobayashi et al. Sci Rep. .

Abstract

Sphingosine 1-phosphate (S1P) is an intercellular signaling molecule present in blood. Erythrocytes have a central role in maintaining the S1P concentration in the blood stream. We previously demonstrated that S1P is exported from erythrocytes by a glyburide-sensitive S1P transporter. However, the gene encoding the S1P transporter in erythrocytes is unknown. In this study, we found that the mouse erythroid cell line, MEDEP-E14, has S1P export activity and exhibits properties that are consistent with those of erythrocytes. Using microarray analysis of MEDEP-E14 cells and its parental cell line, E14TG2a, we identified several candidate genes for S1P export activity. Of those genes, only one gene, Mfsd2b, showed S1P transport activity. The properties of S1P release by MFSD2B were similar to those in erythrocytes. Moreover, knockout of MFSD2B in MEDEP-E14 cells decreased S1P export from the cells. These results strongly suggest that MFSD2B is a novel S1P transporter in erythroid cells.


Conflict of interest statement

The authors declare no competing interests.

Figures

Figure 1
Figure 1
S1P synthesis and secretion in MEDEP-E14 and E14TG2a cells. (A) MEDEP-E14 cells (4 × 105 cells) were incubated in the IMDM releasing medium with or without 5 μM sphingosine for two hours at 37 °C. The experiments were repeated three times (n = 3), and the error bars indicate the S.D. B, C. E14TG2a cells were incubated in the GMEM releasing medium containing 5 μM sphingosine at 37 °C for the indicated time. MEDEP-E14 cells (4 × 105 cells) were incubated in the IMDM releasing medium containing 5 μM sphingosine for the indicated time at 37 °C. The amounts of S1P in the medium (extracellular, B) and cells (intracellular, C) were quantified. The experiments were repeated four times (n = 4), and the error bars indicate the S.D.
Figure 2
Figure 2
Effect of the erythrocyte S1P transporter inhibition on S1P and NBD-S1P export from MEDEP-E14 cells. (A–C) The assay was performed according to the procedures described in the materials and methods section, except that the concentration of BSA in the releasing medium was 0.1%. A, B. MEDEP-E14 cells (4 × 105 cells) were pre-incubated in 190 μL of the IMDM releasing medium containing the indicated compounds at 37 °C for 10 min. Then, 10 μL of the IMDM releasing medium containing 100 μM sphingosine was added to the cell suspension. The final concentration of sphingosine, glyburide, MK571, Cyclosporine A and FTC were 5, 500, 50, 10 and 20 μM, respectively. After incubation at 37 °C for 30 min, the amount of S1P in the medium (A) and cells (B) was quantified. The experiments were repeated four times (n = 4), and the error bars indicate the S.D. Asterisk indicates a significant difference (P < 0.01; Tukey-Kramer test). (C) MEDEP-E14 cells (2 × 106 cells) were pre-incubated in 94.5 μL of the IMDM releasing medium in the presence or absence of 500 μM glyburide at 37 °C for 10 min. Then, 5 μL of the IMDM releasing medium containing 100 μM NBD-sphingosine was added to the cell suspension. The final concentration of sphingosine was 5 μM. After incubation at 37 °C for 1 hr, the lipids in the cells and medium were extracted and analyzed by TLC. The amounts of NBD-S1P were quantified as described previously. The relative amount of extracellular NBD-S1P was calculated by setting the total amount of NBD-S1P in the absence of inhibitor (none) to 100%. The experiments were repeated three times (n = 3), and the error bars indicate the S.D. Asterisk indicates a significant difference (P < 0.01; Welch’s t-test).
Figure 3
Figure 3
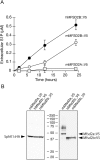
MFSD2B has the export activity of an endogenous S1P in cells. (A) CHO/SPHK1 cells stably expressing V5-tagged mouse MFSD2B (mMFSD2B::V5; open circle), human MFSD2B (hMFSD2B::V5; closed circle) or mouse MFSD2A (mMFSD2A::V5; closed square) were cultured in 6-well plates for two days. F12 releasing medium was added to the cells, which were then incubated for the indicated time periods. The amount of S1P in the releasing medium was determined as described in “Materials and Methods”. The experiments were repeated three times (n = 4), and the error bars indicate the S.D. (B) Membrane fractions from each of the transporters expressed in cells were isolated and subjected to Western blotting with anti-V5-HRP mAb. Expression of HA-tagged SPHK1 was detected with anti-HA mAb labeled with HRP and was used as a loading control for each sample.
Figure 4
Figure 4
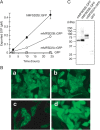
Localization and S1P export activity of GFP-tagged MFSD2B in cells. (A) CHO/SPHK1 cells stably expressing GFP-tagged mouse MFSD2B (mMFSD2B::GFP; open circle), human MFSD2B (hMFSD2B::GFP; closed circle), mouse MFSD2A (mMFSD2A::GFP; open square) or GFP alone (open triangle) were cultured in 6-well plates for two days. (A) Export activity of endogenous S1P in the cells was measured. The F12 releasing medium was added to the cells, and the cells were incubated for the indicated time. The amount of S1P in the releasing medium was determined as described in “Materials and Methods”. The experiments were repeated three times (n = 3), and the error bars indicate the S.D. (B) Fluorescent images of GFP-tagged mouse MFSD2B (a), human MFSD2B (b), mouse MFSD2A (c) or GFP alone (d) expressing cells were obtained by fluorescence microscopy. (C) Membrane fractions from each transporter expressed in cells were isolated and subjected to Western blotting with an anti-GFP mAb.
Figure 5
Figure 5
Effect of the erythrocyte S1P transporter inhibitor on S1P export activity of mouse MFSD2B. (A,B) CHO/SPHK1 cells stably expressing V5-tagged mouse MFSD2B were cultured in 6-well plates for two days. The F12 releasing medium containing 5 µM sphingosine and each transporter inhibitor was added to the cells. The final concentrations of glyburide, MK571, cyclosporine A and FTC were 500, 50, 10 and 20 µM, respectively. After incubation at 37 °C for two hours, the amount of S1P in the medium (A) or cells (B) was quantified. The experiments were repeated four times (n = 4), and the error bars indicate the S.D. Asterisk indicates a significant difference (P < 0.05; Tukey-Kramer test).
Figure 6
Figure 6
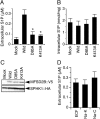
S1P export activity from CHO/SPHK1 cells expressing mouse MFSD2B mutants. (A,B) CHO/SPHK1 cells stably expressing V5-tagged wild-type (Wild) or mutant (D85A or K413A) mouse MFSD2B were cultured in 6-well plates for two days. CHO/SPHK1 cells containing only the expression vector was used for a control (Mock). F12 releasing medium containing 5 µM sphingosine was added to the cells. After incubation at 37 °C for two hours, the amount of S1P in the medium (A) or cells (B) was quantified. The experiments were repeated three times (n = 6), and the error bars indicate the S.D. Asterisks indicate significant differences (P < 0.01 vs. wild-type; Tukey-Kramer test). (C) CHO/SPHK1 cells stably expressing V5-tagged wild-type mouse MFSD2B (wild) or mutated mouse MFSD2B (D85 A or K413A) were analyzed by Western blotting with an anti-V5-HRP mAb. Expression of HA-tagged SPHK1 was detected with an anti-HA mAb labeled with HRP and was used for a loading control for each sample. A full-length blot image is shown in Supplemental Fig. 5A. (D) CHO/SPHK1 cells stably expressing V5-tagged mouse MFSD2B were cultured in 6-well plates for two days. ECF releasing medium (ECF), releasing medium in which Na+ was replaced with K+ (Na-K), or releasing medium in which Na+ was replaced with choline (Na-Choline) containing 5 µM sphingosine was added to the cells. After incubation at 37 °C for two hours, the amount of S1P in the medium was quantified. The experiments were repeated three times (n = 3), and the error bars indicate the S.D.
Figure 7
Figure 7
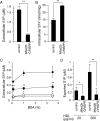
Loss-of-function analysis of MFSD2B using the CRISPR/Cas9 system. (A,B) MEDEP-E14 cells infected with lentivirus encoding random DNA control (control) or lentivirus encoding Cas9-gRNA targeting Mfsd2b (CRISPR-Mfsd2b) (4 × 105 cells) were incubated in IMDM releasing medium with 5 μM sphingosine for two hours at 37 °C. The amounts of S1P in the medium (A) and cells (B) were quantified. The experiments were repeated four times (n = 5), and the error bars indicate the S.D. BSA (C) or HDL (D) concentration-dependent S1P export from MEDEP-E14 control and CRISPR- Mfsd2b cells was measured. The cells were pre-incubated in IMDM containing 0.1% BSA and 5 μM sphingosine at 37 °C for 10 min. Then, the cells were washed once with IMDM and incubated with IMDM containing different concentrations of BSA (0.1, 1, and 3.5%) or HDL (20 and 500 μg/ml) at 37 °C for 30 min. The amounts of S1P in the medium were quantified. (C) Open and closed circles indicate the extracellular S1P concentration of MEDEP-E14 control cells at 0 min and 30 min, respectively. Open and closed squares indicate the extracellular S1P concentration of MEDEP-E14 CRISPR- Mfsd2b cells at 0 min and 30 min, respectively. The experiments were repeated four times (n = 4), and the error bars indicate the S.D. (D) Amount of HDL-dependent export was determined by subtraction of the amount of extracellular S1P at 0 min from that at 30 min. The experiments were repeated four times (n = 4), and the error bars indicate the S.D. Asterisk indicate a statistically significant difference (*P < 0.05, **P < 0.01; Welch’s t-test) against MEDEP-E14 control.
Figure 8
Figure 8
Tissue distribution of mouse Mfsd2b mRNAs and expression of mouse Mfsd2b in erythroid cells. (A) Total RNA isolated from various mouse tissues and MEDEP-E14 cells was subjected to RT-PCR. Amplified products of Mfsd2b and Gapdh were analyzed by 1.5% agarose gel electrophoresis. Full-length gel images were indicated in Supplemental Fig. 6. (B) Expression of MFSD2B protein in the mock-transfected CHO/SPHK1 cells (CHO/control), CHO/SPHK1 cells stably expressing MFSD2B (CHO/MFSD2B), MEDEP-E14 cells and mouse erythrocytes (RBC) was detected by Western blotting with rabbit anti-mouse MFSD2B polyclonal antibodies. Full-length blot image was indicated in Supplemental Fig. 5B.

Similar articles

Cited by

References

    1. Spiegel S, Milstien S. The outs and the ins of sphingosine-1-phosphate in immunity. Nature reviews. Immunology. 2011;11:403–415. doi: 10.1038/nri2974. - DOI - PMC - PubMed
    1. Cyster JG, Schwab SR. Sphingosine-1-phosphate and lymphocyte egress from lymphoid organs. Annu Rev Immunol. 2012;30:69–94. doi: 10.1146/annurev-immunol-020711-075011. - DOI - PubMed
    1. Proia RL, Hla T. Emerging biology of sphingosine-1-phosphate: its role in pathogenesis and therapy. J Clin Invest. 2015;125:1379–1387. doi: 10.1172/JCI76369. - DOI - PMC - PubMed
    1. Ishii M, et al. Sphingosine-1-phosphate mobilizes osteoclast precursors and regulates bone homeostasis. Nature. 2009;458:524–528. doi: 10.1038/nature07713. - DOI - PMC - PubMed
    1. Blaho VA, Hla T. An update on the biology of sphingosine 1-phosphate receptors. J Lipid Res. 2014;55:1596–1608. doi: 10.1194/jlr.R046300. - DOI - PMC - PubMed

Publication types