. 2018 Mar 21;8(1):4938.
doi: 10.1038/s41598-018-23368-5.

Impedance-based analysis of Natural Killer cell stimulation

Affiliations

Impedance-based analysis of Natural Killer cell stimulation

Frank Fasbender et al. Sci Rep. .

Abstract

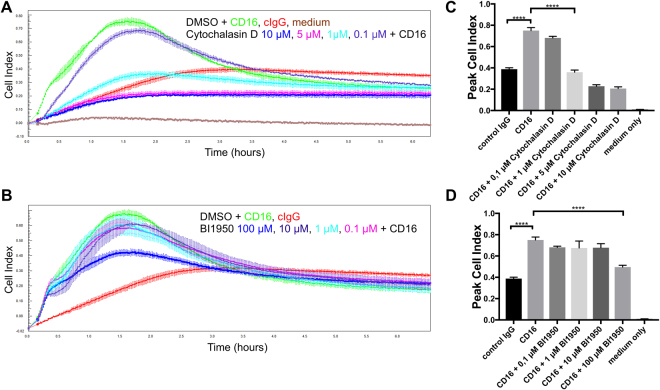
The use of impedance-based label free cell analysis is increasingly popular and has many different applications. Here, we report that a real-time cell analyzer (RTCA) can be used to study the stimulation of Natural Killer (NK) cells. Engagement of NK cells via plate-bound antibodies directed against different activating surface receptors could be measured in real time using the label-free detection of impedance. The change in impedance was dependent on early signal transduction events in the NK cells as it was blocked by inhibitors of Src-family kinases and by inhibiting actin polymerization. While CD16 was the only receptor that could induce a strong change in impedance in primary NK cells, several activating receptors induced changes in impedance in expanded NK cells. Using PBMCs we could detect T cell receptor-mediated T cell activation and CD16-mediated NK cell activation in the same sample. Performing a dose-response analysis for the Src-family kinases inhibitor PP1 we show that T cells are more sensitive to inhibition compared to NK cells. Our data demonstrate that the RTCA can be used to detect physiological activation events in NK cells in a label-free and real-time fashion.


Conflict of interest statement

The authors declare no competing interests.

Figures

Figure 1
Figure 1
Cell Index reflects NK cell activation. (A) Cultured human NK cells were pre-incubated for 30 min with PP1 or DMSO as carrier control and seeded in technical triplicates onto non-coated E-plates (cells only) or on E-plates pre-coated with goat-anti-mouse antibodies in combination with control antibodies (cIgG) or antibodies directed against CD16. Cell index was recorded for 2 hours every 1 min. (B) Peak Cell Index values for the indicated conditions. (C) NK cells from (A) were removed from the E-plate after 2 hours and analyzed by flow cytometry for CD107a positive cells. Error bars depict technical triplicates from the same experiment and donor. The shown experiment is representative of three biological replicates.
Figure 2
Figure 2
CI changes are dependent on actin polymerization but independent of LFA-1. Cultured human NK cells were pre-incubated for 30 min with (A,C) Cytochalasin D, (B,D) BI-1950 or DMSO as carrier control and seeded in technical triplicates onto E-plates pre-coated with goat-anti-mouse antibodies in combination with control antibodies (cIgG) or antibodies directed against CD16. Cell index was recorded for 6 hours every 1 min. Error bars depict technical triplicates and the shown experiment is representative of three biological replicates.
Figure 3
Figure 3
Profiles of resting and pre-activated NK cells. Equal numbers of (A) resting or (B) pre-activated NK cells from different healthy donors were seeded in duplicates onto E-Plates pre-coated with the indicated antibodies. Controls with goat anti-mouse, only cells and only medium were included. Cell index was recorded every 30 s for 6 hours. The peak cell index for each donor is shown in the bar graphs. Error bars depict technical duplicates. All biological replicates from different donors are shown and quantified.
Figure 4
Figure 4
Co-activation of resting NK cells. Equal numbers of resting NK cells were seeded in technical duplicates onto E-Plates pre-coated with antibodies against the indicated receptors. Cell index was recorded every 30 s for 6 hours.
Figure 5
Figure 5
NK cells and T cells show different sensitivities for PP1. Freshly isolated PBMCs were pre-incubated with indicated concentrations of PP1 and seeded in technical duplicates on E-Plates pre-coated with antibodies against (A) CD16 or (B) CD3/CD28. CI was recorded for 6 hours every 30 s. (C) PP1 IC50 for T cells and NK cells was calculated using RTCA analysis software 1.0. (n = 6, p = 0.0063, Paired t-test).

References

    1. Vivier E, Tomasello E, Baratin M, Walzer T, Ugolini S. Functions of natural killer cells. Nature Immunology. 2008;9:503–510. doi: 10.1038/ni1582. - DOI - PubMed
    1. Jost S, Altfeld M. Control of human viral infections by natural killer cells. Annu Rev Immunol. 2013;31:163–194. doi: 10.1146/annurev-immunol-032712-100001. - DOI - PubMed
    1. Watzl C. How to trigger a killer: modulation of natural killer cell reactivity on many levels. Adv Immunol. 2014;124:137–170. doi: 10.1016/B978-0-12-800147-9.00005-4. - DOI - PubMed
    1. Shi FD, Ljunggren HG, La Cava A, Van Kaer L. Organ-specific features of natural killer cells. Nat Rev Immunol. 2011;11:658–671. doi: 10.1038/nri3065. - DOI - PMC - PubMed
    1. Fasbender F, Widera A, Hengstler JG, Watzl C. Natural Killer Cells and Liver Fibrosis. Front Immunol. 2016;7:19. doi: 10.3389/fimmu.2016.00019. - DOI - PMC - PubMed

Publication types