. 2018 Mar 21;8(1):4984.
doi: 10.1038/s41598-018-22676-0.

Profiling walking dysfunction in multiple sclerosis: characterisation, classification and progression over time

Affiliations

Profiling walking dysfunction in multiple sclerosis: characterisation, classification and progression over time

Linard Filli et al. Sci Rep. .

Abstract

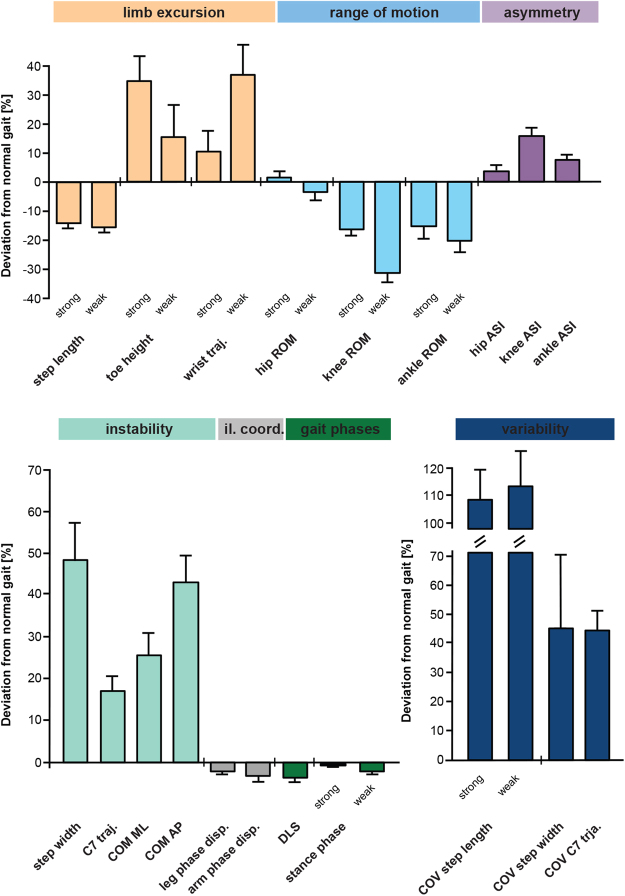
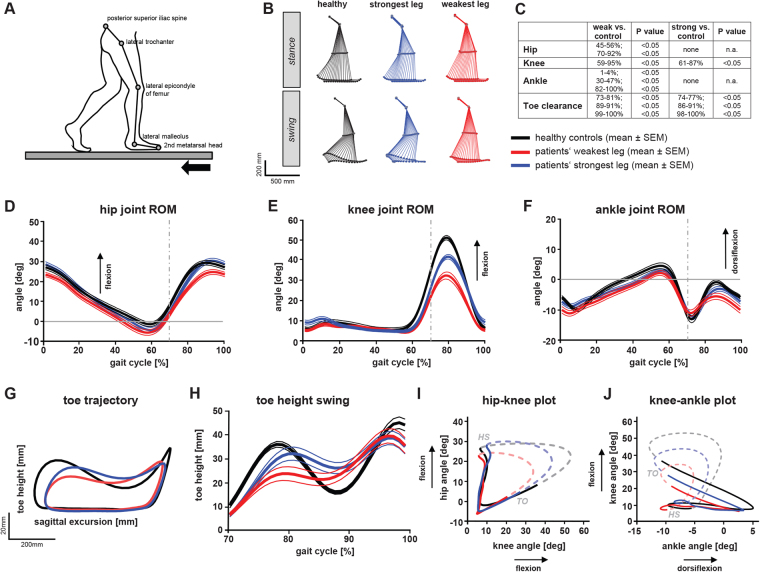
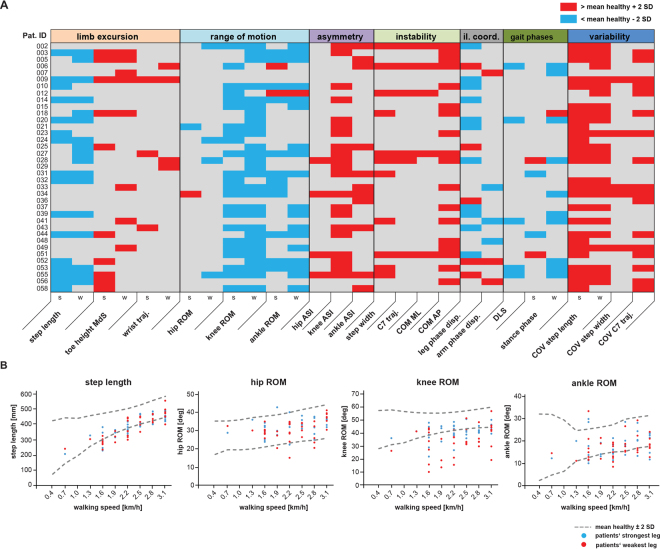
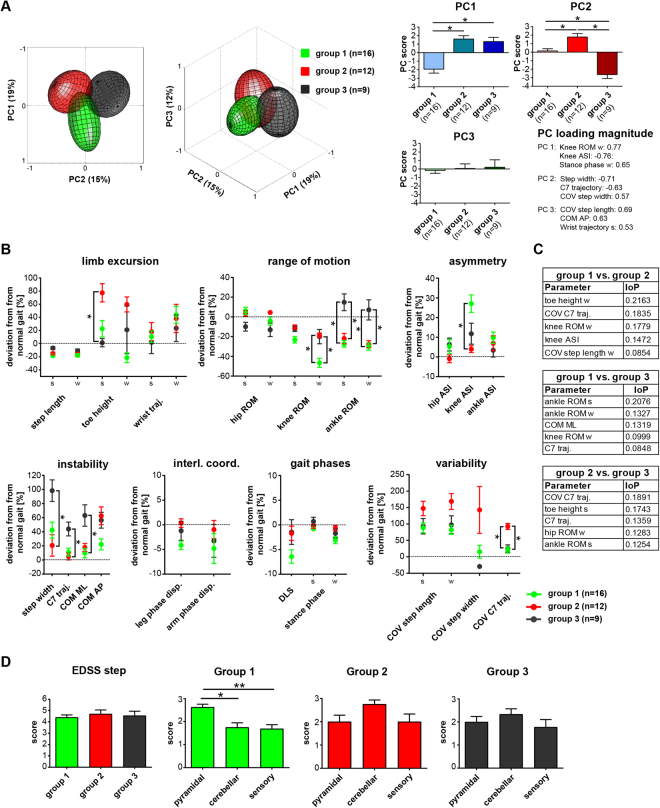
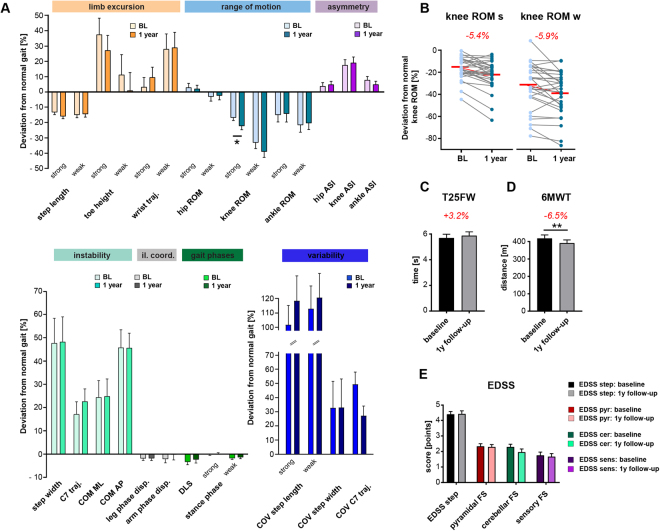
Gait dysfunction is a common and relevant symptom in multiple sclerosis (MS). This study aimed to profile gait pathology in gait-impaired patients with MS using comprehensive 3D gait analysis and clinical walking tests. Thirty-seven patients with MS walked on the treadmill at their individual, sustainable speed while 20 healthy control subjects walked at all the different patient's paces, allowing for comparisons independent of walking velocity. Kinematic analysis revealed pronounced restrictions in knee and ankle joint excursion, increased gait variability and asymmetry along with impaired dynamic stability in patients. The most discriminative single gait parameter, differentiating patients from controls with an accuracy of 83.3% (χ2 test; p = 0.0001), was reduced knee range of motion. Based on hierarchical cluster and principal component analysis, three principal pathological gait patterns were identified: a spastic-paretic, an ataxia-like, and an unstable gait. Follow-up assessments after 1 year indicated deterioration of walking function, particularly in patients with spastic-paretic gait patterns. Our findings suggest that impaired knee/ankle control is common in patients with MS. Personalised gait profiles and clustering algorithms may be promising tools for stratifying patients and to inform patient-tailored exercise programs. Responsive, objective outcome measures are important for monitoring disease progression and treatment effects in MS trials.


Conflict of interest statement

The authors declare no competing interests.

Figures

Figure 1
Figure 1
Characterisation of MS-related gait pathology based on 28 key walking parameters. Gait markers of limb excursion (salmon pink), parameters of range of motion (blue), asymmetry (purple), stability (turquoise) and variability (dark blue) revealed substantial changes of walking pattern in patients with MS (n = 37) walking at half-maximal gait speed (vmax50%) compared to normative data obtained from 20 healthy control participants walking at identical speeds. Bars represent mean values ± SEM. Abbreviations: ASI: asymmetry index; AP: anteroposterior; COM: centre of mass; COV: coefficient of variation; disp.: dispersion; DLS: double-limb support; il. coord.: inter-limb coordination; strong: strongest leg; weak: weakest leg; ML: mediolateral; ROM: range of motion; traj.: trajectory.
Figure 2
Figure 2
Temporal and spatial deviations in gait pattern of patients with MS compared to controls. Both patients and controls walked at a fixed speed of 2 km/h. (A) Schematic illustration of stick figure and marker position overlying anatomical landmarks. (B) Average stick figures of healthy participants (n = 20; black) and patients (n = 28; strongest leg (blue); weakest leg (red)) during stance and swing phase. (C) Statistical analysis (two-way ANOVA repeated measures) depicting periods (gait phases; left) and p-values (right) of significant differences between angular hip, knee and ankle excursions of patients (strongest and weakest leg) and healthy controls (see DF). (DF) Hip, knee and ankle angular excursions ± SEM during an averaged step cycle (groups and colors as in B; grey dashed line indicates toe-off). (G) 2-dimensional toe trajectory illustrating the sagittal movement pattern of the lower extremity endpoint (groups and colors as in B). (H) Toe clearance during swing phase (groups and colors as in B). (I, J) Angle-angle plots (cyclograms) depicting intra-limb coordination of the hip, knee and ankle during stance (straight line) and swing phase (dashed line) (groups and colors as in B). Abbreviations: deg: degrees; strong: strongest leg; weak: weakest leg; ROM: range of motion.
Figure 3
Figure 3
Individual gait profiles of patients with MS. (A) Kinematic gait parameters for single subjects with MS (n = 37) walking at half-maximal gait speed (vmax50%) represented in a color-coded grading system. Twenty-eight parameters were classified as normal/unchanged (grey), pathologically reduced (blue) or pathologically increased (red) based on normative data obtained from 20 healthy controls. (B) Graphs show changes in selected gait parameters in subjects with MS in relation to walking speed. Values located outside the interval of the mean ± 2 SD of 20 healthy control subjects (dashed grey line) were defined as pathological. Data for the weakest leg is displayed in red, while values for the strongest leg are shown in blue. Abbreviations: AP: anteroposterior; ASI: asymmetry index; COM: centre of mass; COV: coefficient of variation; disp.: dispersion; deg: degrees; DLS: double-limb support; il. coord.: inter-limb coordination; s: strongest leg; MdS: midswing; ML: mediolateral; Pat. ID: patient identification number; ROM: range of motion; SD: standard deviation; traj.: trajectory; w- weakest leg.
Figure 4
Figure 4
Kinematic gait patterns of three subgroups of patients with MS as identified by hierarchical cluster analysis. Gait parameters were assessed at patients’ half-maximal walking speed (vmax50%) (A) Principal component analysis (PCA) visualizing the locomotor pattern of the three cluster subgroups (group 1: n = 16; green; group 2: n = 12; red; group 3: n = 9; black) in the 3-dimensional PC space. Graphs on the right show mean scores on PC1–3 for all three cluster subgroups. Asterisk indicates statistically significant differences (p < 0.05) between PCs for different cluster subgroups as revealed by 1-way ANOVA repeated measures with post hoc correction for multiple testing. Variables showing the highest factor loading on PC1, PC2 and PC3 (i.e. correlation between each variable and PC space) are depicted (right low corner). (B) Gait profiles of the three cluster subgroups based on single kinematic parameters. Dots represent group mean values ± SEM for each cluster subgroup. Asterisk indicates statistically significant differences between subgroups as analysed by 1-way ANOVA repeated measures followed by post hoc correction for multiple comparisons (*p < 0.05/28 = 0.0018). (C) ReliefF feature selection algorithm was used to quantify the importance of predictors (IoP) to distinguish the different cluster groups of specific kinematic parameters (D) Expanded Disability Status Scale scores for the different cluster subgroups (group 1: green; group 2: red; group 3: black). Asterisk indicates statistically significant differences between groups as revealed by 1-way ANOVA repeated measures (*p < 0.05; **p < 0.01). Data are presented as mean ± SEM. Abbreviations: AP: anteroposterior; ASI: asymmetry index; COM: centre of mass; COV: coefficient of variation; disp.: dispersion; DLS: double-limb support; EDSS: Expanded Disability Status Scale; interl.coord.: inter-limb coordination; s: strongest leg; ML: mediolateral; w- weakest leg; PC: principal component; ROM: range of motion; SD: standard deviation; traj.: trajectory.
Figure 5
Figure 5
Monitoring kinematic gait parameters and clinical walking performance in patients with MS over a period of 1 year. Gait analysis in patients (n = 29) was performed at baseline and 12 months later at identical walking speeds (vmax50%). (A) Gait profiles including 28 kinematic parameters with darker colors representing parameter values at baseline and brighter colors indicating values at the 1-year follow-up assessment. Bars represent mean ± SEM. Statistical analysis was performed by two-tailed, paired t-test followed by post hoc correction for multiple testing. Asterisk indicates p-value below the adjusted level of significance (α = 0.05/28). (B) Changes of individual patients’ knee ROM over 1 year for the weakest and strongest leg. Group mean changes in knee ROM between baseline and follow-up measurements are highlighted in red numbers. (C) Maximal walking speed (assessed with the timed 25-foot walk) was not significantly different, whereas (D) walking endurance (measured with the 6-minute walk test; 6MWT) showed a significant decline over time. Statistical significance was assessed by two-tailed, paired t-test. (E) Longitudinal assessment of the EDSS step and the functional system scores (pyramidal, cerebellar and sensory) did not reveal any significant differences over 1 year (two-tailed, paired t-test). Abbreviations: AP: anteroposterior; ASI: asymmetry index; COM: centre of mass; COV: coefficient of variation; disp.: dispersion; DLS: double-limb support; EDSS: Expanded Disability Status Scale; FS: functional system; cer: cerebellar; interl.coord.: inter-limb coordination; strong: strongest leg; ML: mediolateral; weak: weakest leg; pyr: pyramidal; ROM: range of motion; SD: standard deviation; sens: sensory; traj.: trajectory; T25FW: Timed 25-foot walk; v50%: half-maximal walking speed; y: year; 6MWT: 6-minute walk test.

References

    1. Alonso A, Hernan MA. Temporal trends in the incidence of multiple sclerosis: a systematic review. Neurology. 2008;71:129–135. doi: 10.1212/01.wnl.0000316802.35974.34. - DOI - PMC - PubMed
    1. Hobart JC, Riazi A, Lamping DL, Fitzpatrick R, Thompson AJ. Measuring the impact of MS on walking ability: the 12-Item MS Walking Scale (MSWS-12) Neurology. 2003;60:31–36. doi: 10.1212/WNL.60.1.31. - DOI - PubMed
    1. Kister I, et al. Disability in multiple sclerosis: a reference for patients and clinicians. Neurology. 2013;80:1018–1024. doi: 10.1212/WNL.0b013e3182872855. - DOI - PMC - PubMed
    1. Heesen C, et al. Patient perception of bodily functions in multiple sclerosis: gait and visual function are the most valuable. Mult Scler. 2008;14:988–991. doi: 10.1177/1352458508088916. - DOI - PubMed
    1. Scheinberg L, et al. Multiple sclerosis; earning a living. N Y State J Med. 1980;80:1395–1400. - PubMed

Publication types