. 2018 Mar 21;8(1):4937.
doi: 10.1038/s41598-018-23362-x.

Analysis of Long Term Study Indicates Both Agronomic Optimal Plant Density and Increase Maize Yield per Plant Contributed to Yield Gain

Affiliations

Analysis of Long Term Study Indicates Both Agronomic Optimal Plant Density and Increase Maize Yield per Plant Contributed to Yield Gain

Yared Assefa et al. Sci Rep. .

Abstract

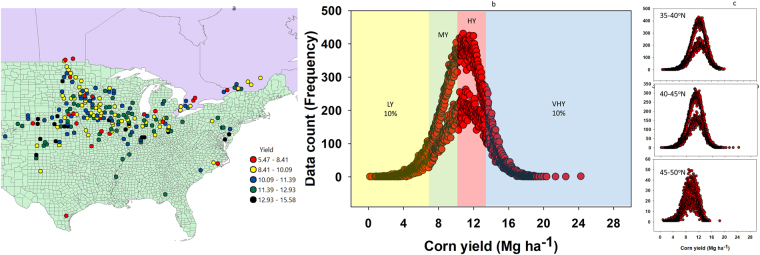
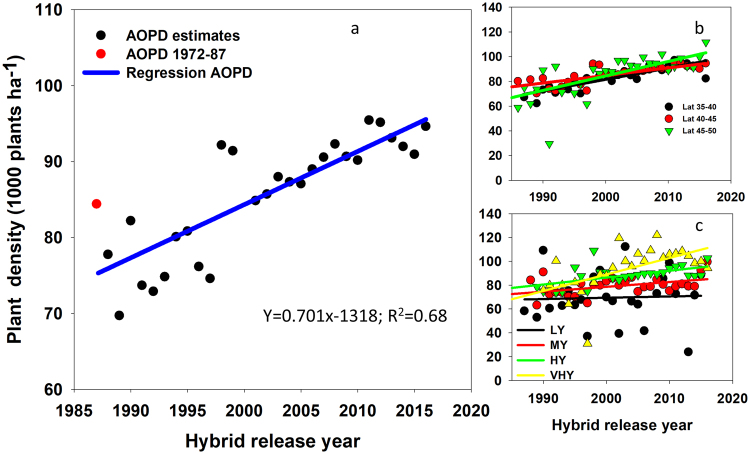
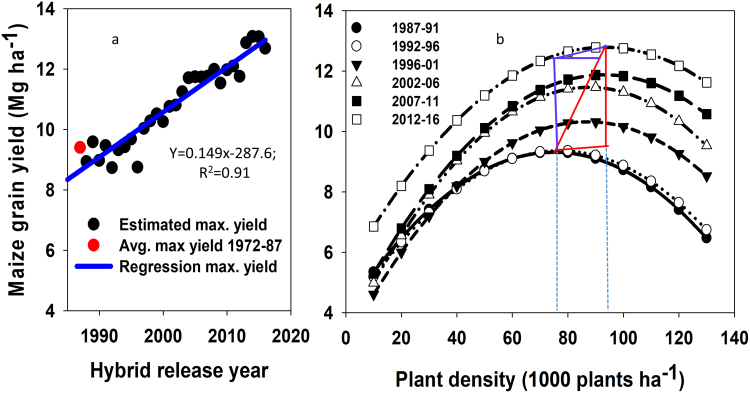
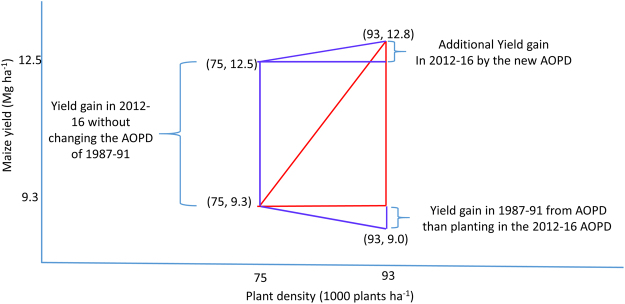
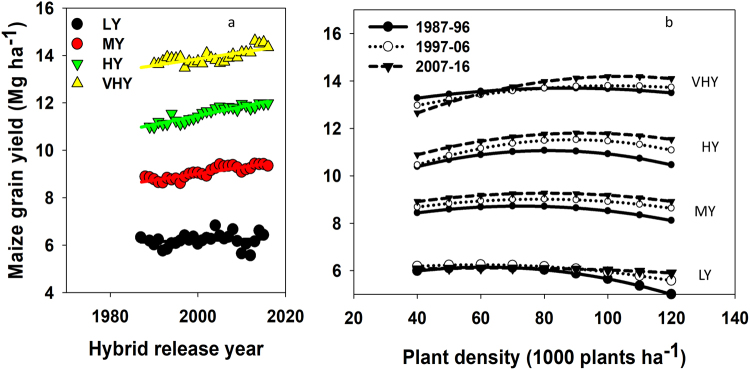
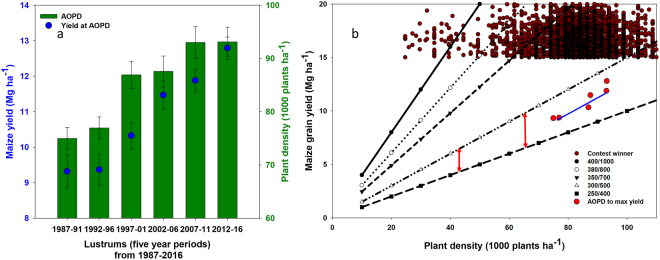
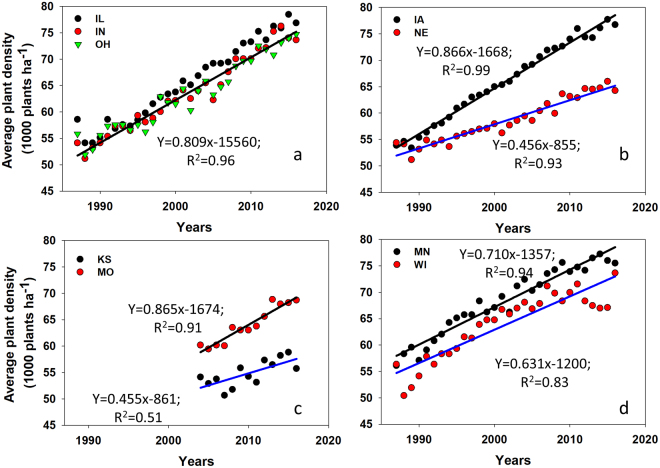
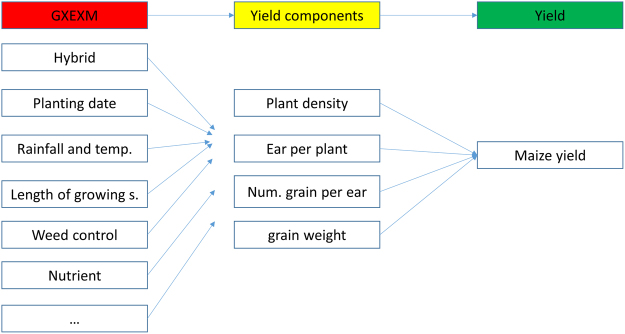
Concurrent to yield, maize (Zea Mays L.) plant density has significantly increased over the years. Unlike yield, however, the rate of change in plant density and its contribution to maize yield gain are rarely reported. The main objectives of this study were to examine the trend in the agronomic optimum plant density (AOPD) and quantify the contribution of plant density to yield gain. Maize hybrid by seeding rate trials were conducted from 1987-2016 across North America (187,662 data points). Mixed model, response surface, and simple linear regression analyses were applied on the meta-data. New outcomes from this analysis are: (i) an increase in the AOPD at rate of 700 plant ha-1 yr-1, (ii) increase in the AOPD of 1386, 580 and 404 plants ha-1 yr-1 for very high yielding (VHY, > 13 Mg ha-1), high yielding (HY, 10-13 Mg ha-1) and medium yielding (MY, 7-10 Mg ha-1), respectively, with a lack of change for the low yielding (LY, < 7 Mg ha-1) environment; (iii) plant density contribution to maize yield gain ranged from 8.5% to 17%, and (iv) yield improvement was partially explained by changes in the AOPD but we also identified positive impacts on yield components as other sources for yield gain.


Conflict of interest statement

The authors declare no competing interests.

Figures

Figure 1
Figure 1
Location average yield classified in five groups (a), over all data distribution and yield environments (b), and yield distribution by three major latitude groups (c) for the maize hybrid seeding trial 1987–2016. Not all counties, states, provinces, or hybrids were present every year. LY, low yielding environment constituted the lower 10% of the data; MY, medium yielding environment; HY, high yielding environment; and VHY, very high yielding environment, which constituted the top 10% of the data.
Figure 2
Figure 2
Changes in average agronomic optimum plant density (AOPD) over hybrid release year (panel a) for the entire North America, (panel b) by latitude group, and (c) by yield environment (LY, low-yielding; MY, medium-yielding; HY, high-yielding; VHY, very-high yielding environments). Red dot in panel a represent AOPD averaged for the hybrid release years 1972–87.
Figure 3
Figure 3
Trend in maximum maize grain yield at the agronomic optimum plant density (AOPD) over hybrid release year in North America (panel a) and models for the relationship between plant density and yield from 1987 through 2016 averaged over five-year periods. Red dot in panel a represent yield at the AOPD (average predicted maximum yield) for the hybrid release years 1972–87. In Panel b, red triangle represents the change in planting density in horizontal side, change in yield in the vertical side of the triangle, and the slope (change in yield over change in planting density) by the hypotenuse of the triangle. Vertical dashed (dotted) lines in panel b indicate the positions of the AOPD at each lustrum. Equations for panels a and b are included in Tables 1 and 2, respectively.
Figure 4
Figure 4
Maize maximum yield and AOPD averages for the 1987–1991 and 2012–2016 lustrums based on results in Fig. 3. The yield change without plant density change is the difference in yield of maize in 2012–2016 compared to 1987–1991 at the AOPD of 1987–1991. Yield change due to AOPD is the difference in yield gain at AOPD in 2012–2016 compared to yield for the same lustrum but at AOPD of 1987–1991. Additional yield gain from change in PD is the difference in yield of maize in 2012–2016 compared to 1987–1991 at the AOPD of 2012–2016.
Figure 5
Figure 5
Changes in maximum maize grain yield at the agronomic optimum plant density (AOPD) over hybrid release year in North America (panel a) and relationship between yield and plant density for the recent three decades (panel b) all relative to yield environment (LY, low-; MY, medium-; HY, high-; and VHY, very high-yielding environments).
Figure 6
Figure 6
Changes in both optimal maize grain yield and AOPD over the last six lustrums (five-year periods) from 1987 through 2016 (panel a) and simulated relationship between plant density and yield at different seed weight (mg seed−1) to seed number (number of seed) combinations (panel b) in a high yielding environment with no resource limitation. A 400/1000 ratio indicates a hybrid that can produce 1000 seeds per plant with each seed weighing 400 mg. Also in the figure are example data points from the National Corn Growers Association Winner database (2011–2016) to demonstrate yields > 15 Mg ha−1 across different seeding rates and how our optimal planting density to yield data (red circles) fits into the simulation. Red two sided arrows in panel b indicate the change in yield gain at similar plant density between two hybrids differing only in seed weight and seed number. Error bars in (panel a) are standard errors.
Figure 7
Figure 7
Trends in USDA reported average plant density for the years from 1987 through 2016 across nine states, which have significant maize production.
Figure 8
Figure 8
Theoretical framework on the effects of genotype (G) by environment (E) by management practices (M) effects on yield and its components, plant density, ear per plant, number of grains per ear, and grain weight. Plant density is a foundational intermediate factor that varies between- and is influenced by- G × E × M and thus affect yield (productivity). The G × E × M determines the yield environment.

Similar articles

Cited by

References

    1. Duvick DN. The contribution of breeding to yield advances in maize (Zea mays L.) Adv. Agron. 2005;86:83–145. doi: 10.1016/S0065-2113(05)86002-X. - DOI
    1. Tollenaar M, Wu J. Yield improvement in temperate maize is attributable to greater stress tolerance. Crop Sci. 1999;39:1597–1604. doi: 10.2135/cropsci1999.3961597x. - DOI
    1. Sangoi L, Gracietti MA, Rampazzo C, Bianchetti P. Response of Brazilian maize hybrids from different ears to changes in plant density. Field Crops Res. 2002;79:39–51. doi: 10.1016/S0378-4290(02)00124-7. - DOI
    1. Qian C, et al. Response of grain yield to plant density and nitrogen rate in spring maize hybrids released from 1970 to 2010 in Northeast China. Crop J. 2016;4:459–467. doi: 10.1016/j.cj.2016.04.004. - DOI
    1. Derieux M, et al. Estimation du progres genetique realise chez les mais grain en France entre 1950 et 1985. Agronomie. 1987;7:1–11. doi: 10.1051/agro:19870101. - DOI

Publication types