. 2018 Jun;32(6):1338-1348.
doi: 10.1038/s41375-018-0068-2. Epub 2018 Feb 25.

Mutation patterns identify adult patients with de novo acute myeloid leukemia aged 60 years or older who respond favorably to standard chemotherapy: an analysis of Alliance studies

Affiliations

Mutation patterns identify adult patients with de novo acute myeloid leukemia aged 60 years or older who respond favorably to standard chemotherapy: an analysis of Alliance studies

Ann-Kathrin Eisfeld et al. Leukemia. 2018 Jun.

Abstract

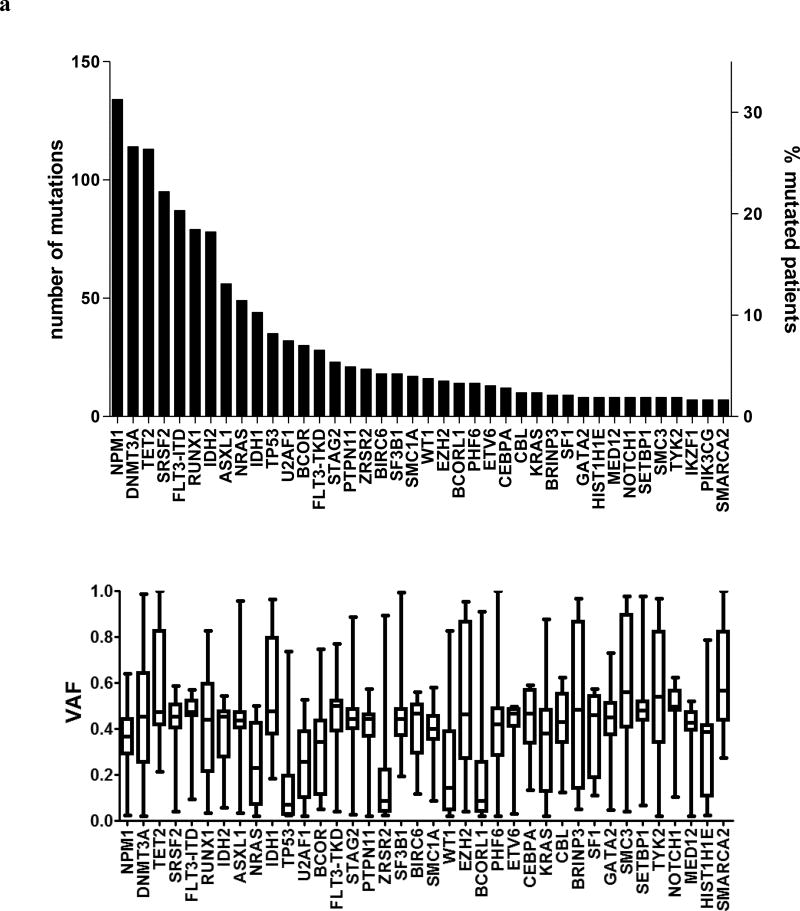
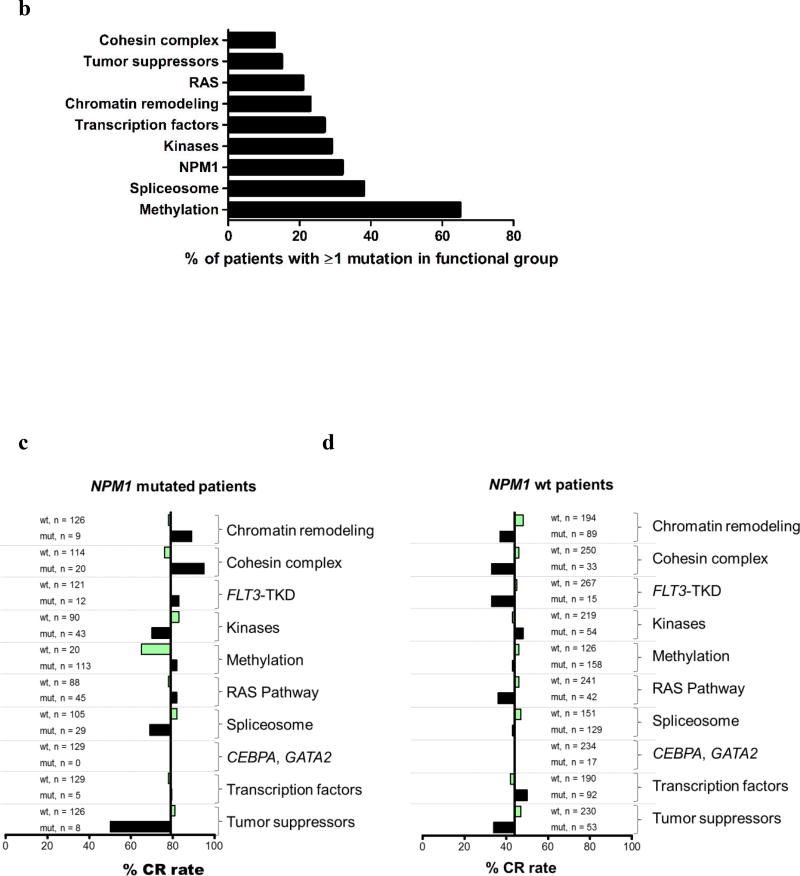
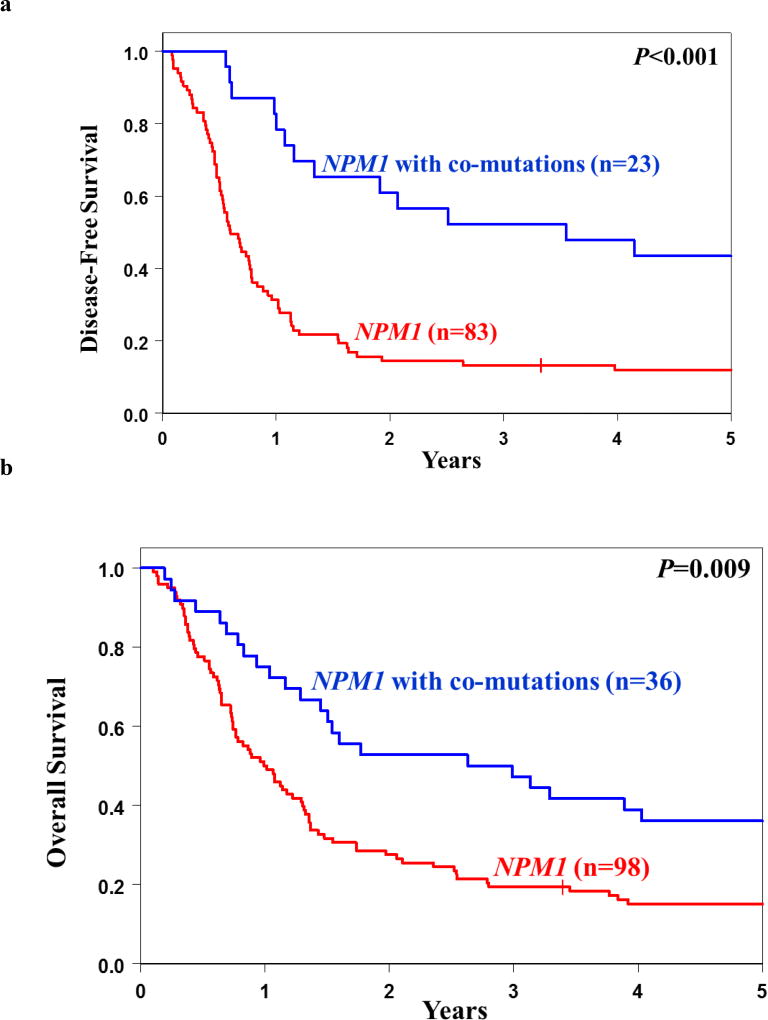
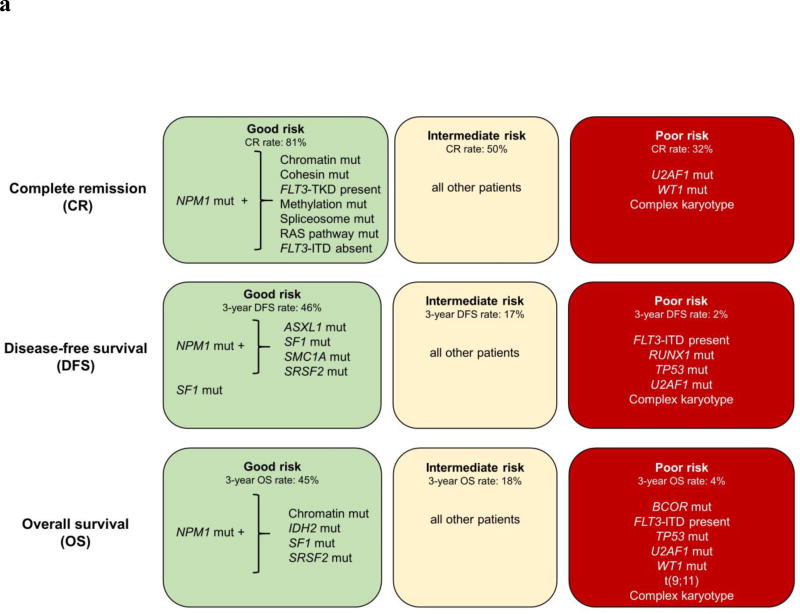
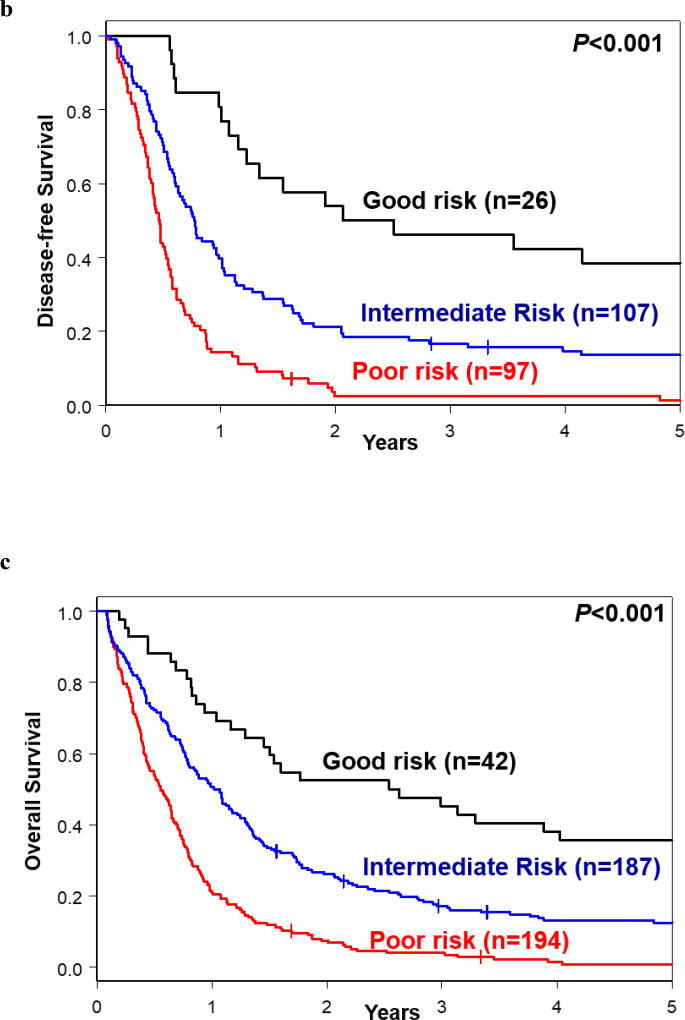
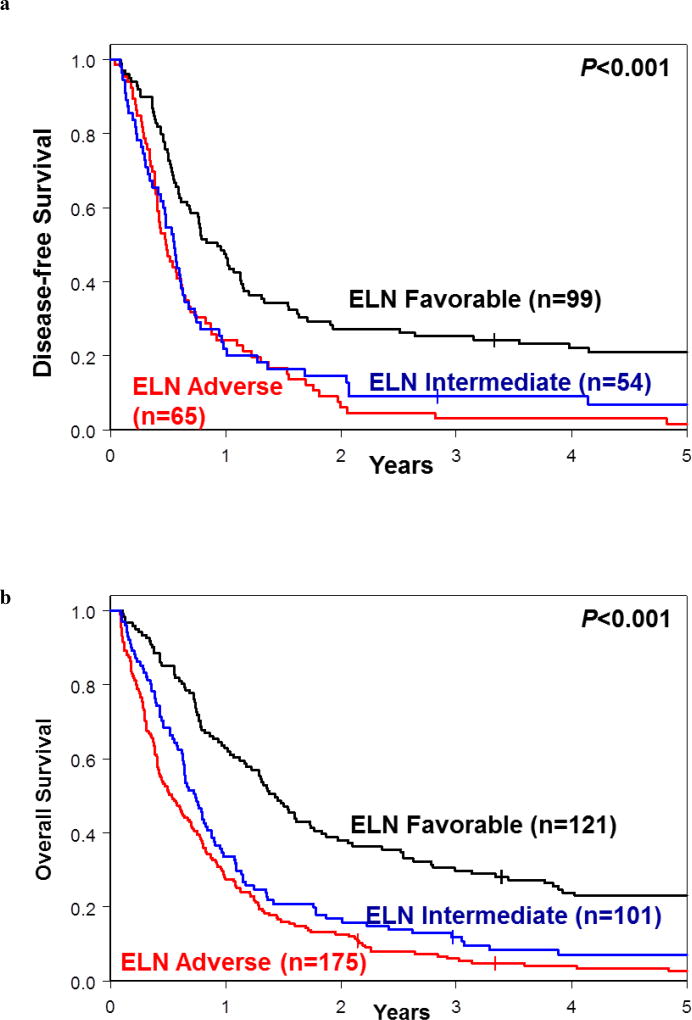
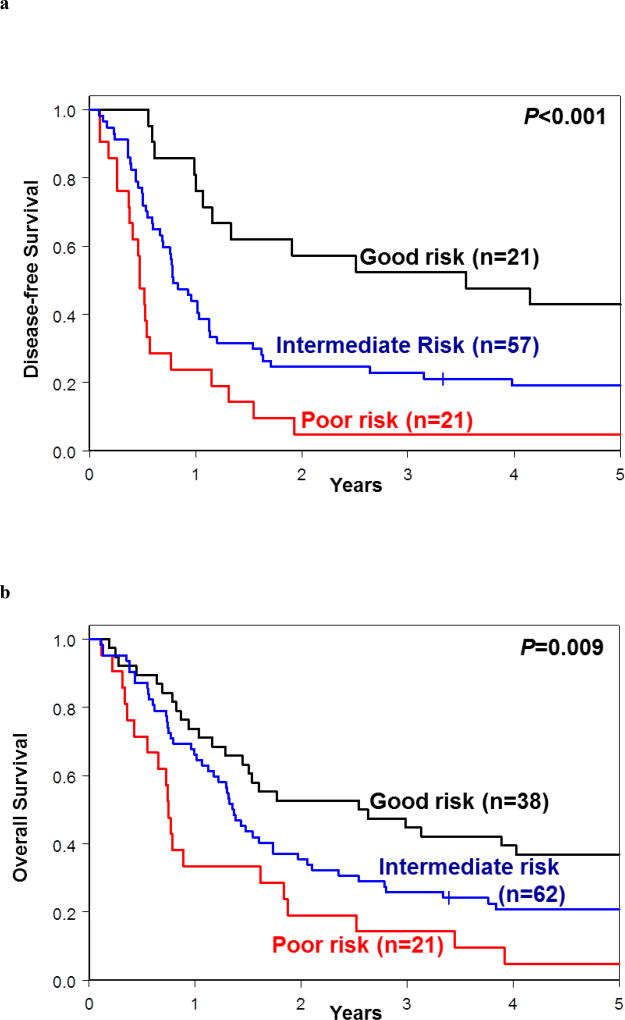
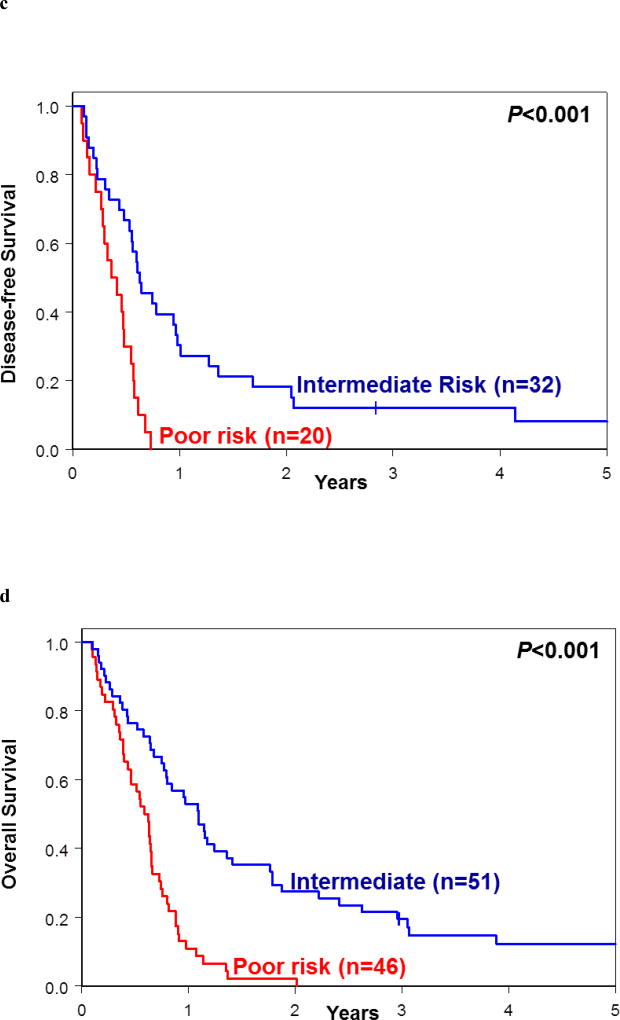
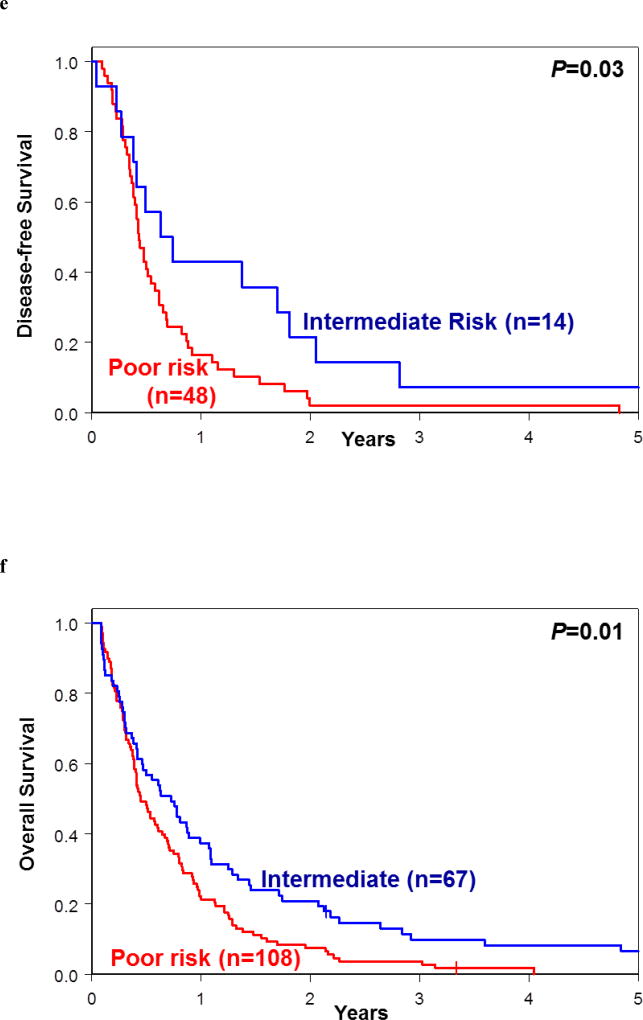
Thus far, only 5-15% of AML patients aged ≥60 years are cured with chemotherapy. Identification of patients who are less (more) likely to respond to standard chemotherapy might enable early risk stratification toward alternative treatment regimens. We used a next-generation sequencing panel of 80 cancer- and/or leukemia-associated genes to profile molecularly 423 older patients with de novo AML. Using variables identified in multivariable models and co-occurring mutations in NPM1-mutated AML, we classified the patients into good-, intermediate-, and poor-risk groups for complete remission (CR) attainment, disease-free (DFS), and overall survival (OS). Whereas 81% of good-risk patients (comprising NPM1-mutated patients harboring mutations in chromatin remodeling, cohesin complex, methylation-related, spliceosome, and/or RAS pathway genes, FLT3-TKD, and/or patients without FLT3-ITD) achieved a CR, only 32% of poor-risk patients (with U2AF1, WT1 mutations and/or complex karyotype) did. Intermediate-risk patients had a 50% CR rate. Similarly, using NPM1 co-mutation patterns and SF1 mutation status, we identified patients with favorable DFS and OS 3-year rates of 46% and 45%, respectively. Patients with adverse genetic features had DFS and OS rates of only 2% and 4%. We show that application of our proposed criteria may refine the 2017 European LeukemiaNet classification for older patients treated with chemotherapy.


Conflict of interest statement

The authors declare no conflicts of interest.

Figures

Figure 1
Figure 1
(a) Upper panel. Bar graph depicting the total number of mutations detected in individual genes (left Y-axis), as well as the percentage of patients with these mutations in our total patient cohort (right Y-axis). Lower panel, box and whiskers plots indicating the variant allele fractions (VAF), with which the mutations were detected in our AML patient set. The horizontal line within each box represents the median VAF, the box encloses the 25th–75th percentiles, and the whiskers represent the range. (b) Bar graph depicting the frequency of mutations in the functional groups, sorted by ascending frequencies. (c) Bar graphs showing the differential impact of co-occurring mutations on the positive prognostic impact of NPM1. The X-axis depicts the CR rates, with the vertical line showing the median CR rate of all NPM1-mutated AML patients (79%). Bars depict how the wild-type (wt, bars in light green) or mutated (mut, bars in black) status of co-occurring mutations in the different functional groups affect the CR rates of NPM1-mutated patients. (d) Bar graphs showing the differential impact of co-occurring mutations on the CR rates of patients with wild-type NPM1 genes. The X-axis depicts the CR rates of NPM1 wt AML patients, with the vertical line showing the median CR rate of 44%. Bars depict how the wild-type (wt, bars in light green) or mutated (mut, bars in black) status of co-occurring mutations in the different functional groups affect the CR rates of NPM1 wt patients.
Figure 1
Figure 1
(a) Upper panel. Bar graph depicting the total number of mutations detected in individual genes (left Y-axis), as well as the percentage of patients with these mutations in our total patient cohort (right Y-axis). Lower panel, box and whiskers plots indicating the variant allele fractions (VAF), with which the mutations were detected in our AML patient set. The horizontal line within each box represents the median VAF, the box encloses the 25th–75th percentiles, and the whiskers represent the range. (b) Bar graph depicting the frequency of mutations in the functional groups, sorted by ascending frequencies. (c) Bar graphs showing the differential impact of co-occurring mutations on the positive prognostic impact of NPM1. The X-axis depicts the CR rates, with the vertical line showing the median CR rate of all NPM1-mutated AML patients (79%). Bars depict how the wild-type (wt, bars in light green) or mutated (mut, bars in black) status of co-occurring mutations in the different functional groups affect the CR rates of NPM1-mutated patients. (d) Bar graphs showing the differential impact of co-occurring mutations on the CR rates of patients with wild-type NPM1 genes. The X-axis depicts the CR rates of NPM1 wt AML patients, with the vertical line showing the median CR rate of 44%. Bars depict how the wild-type (wt, bars in light green) or mutated (mut, bars in black) status of co-occurring mutations in the different functional groups affect the CR rates of NPM1 wt patients.
Figure 2
Figure 2
(a) Disease-free survival (DFS) and (b) overall survival (OS) of NPM1-mutated patients stratified by the presence or absence of co-occurring mutations. The blue line represents patients harboring positive predictive marker in addition to the NPM1 mutation (DFS co-mutations: ASXL1, SF1, SMC1A and SRSF2; OS co-mutations: ASXL1, IDH2, SF1 and SRSF2) and red line represents NPM1-mutated patients without those co-mutations. (c) Variant allele fractions (VAFs) of NPM1 and co-occurring mutations in individual patient samples. NPM1 mutations (black bars) were typically observed at lower VAFs than co-occurring mutations (colored bars), suggesting that the NPM1 mutations are later mutational events.
Figure 2
Figure 2
(a) Disease-free survival (DFS) and (b) overall survival (OS) of NPM1-mutated patients stratified by the presence or absence of co-occurring mutations. The blue line represents patients harboring positive predictive marker in addition to the NPM1 mutation (DFS co-mutations: ASXL1, SF1, SMC1A and SRSF2; OS co-mutations: ASXL1, IDH2, SF1 and SRSF2) and red line represents NPM1-mutated patients without those co-mutations. (c) Variant allele fractions (VAFs) of NPM1 and co-occurring mutations in individual patient samples. NPM1 mutations (black bars) were typically observed at lower VAFs than co-occurring mutations (colored bars), suggesting that the NPM1 mutations are later mutational events.
Figure 3
Figure 3
(a) Genetic risk stratification schema of AML patients for complete remission (CR), disease-free survival (DFS) and overall survival (OS). (b) DFS and (c) OS based on the proposed risk stratification into good-, intermediate- and poor-risk groups.
Figure 3
Figure 3
(a) Genetic risk stratification schema of AML patients for complete remission (CR), disease-free survival (DFS) and overall survival (OS). (b) DFS and (c) OS based on the proposed risk stratification into good-, intermediate- and poor-risk groups.
Figure 4
Figure 4
Outcome of patients classified into the Favorable-, Intermediate- and Adverse-risk groups using the 2017 European LeukemiaNet (ELN) criteria. (a) Disease-free survival and (b) overall survival.
Figure 5
Figure 5
Re-classification of patients assigned into each of the 2017 European LeukemiaNet (ELN) risk groups into the good-, intermediate- and poor-risk groups following application of our proposed genetic risk stratification schema. (a) Disease-free survival and (b) overall survival of re-classified patients belonging to 2017 ELN Favorable-risk group. (c) Disease-free survival and (d) overall survival of re-classified patients belonging to 2017 ELN Intermediate-risk group. (e) Disease-free survival and (f) overall survival of re-classified patients belonging to 2017 ELN Adverse-risk group.
Figure 5
Figure 5
Re-classification of patients assigned into each of the 2017 European LeukemiaNet (ELN) risk groups into the good-, intermediate- and poor-risk groups following application of our proposed genetic risk stratification schema. (a) Disease-free survival and (b) overall survival of re-classified patients belonging to 2017 ELN Favorable-risk group. (c) Disease-free survival and (d) overall survival of re-classified patients belonging to 2017 ELN Intermediate-risk group. (e) Disease-free survival and (f) overall survival of re-classified patients belonging to 2017 ELN Adverse-risk group.

Similar articles

Cited by

References

    1. Döhner H, Weisdorf DJ, Bloomfield CD. Acute myeloid leukemia. N Engl J Med. 2015;373:1136–1152. - PubMed
    1. Arber DA, Orazi A, Hasserjian R, Thiele J, Borowitz MJ, Le Beau MM, et al. The 2016 revision to the World Health Organization classification of myeloid neoplasms and acute leukemia. Blood. 2016;127:2391–2405. - PubMed
    1. Cancer Genome Atlas Research Network. Genomic and epigenomic landscapes of adult de novo myeloid leukemia. N Engl J Med. 2013;368:2059–2074. - PMC - PubMed
    1. Papaemmanuil E, Gerstung M, Bullinger L, Gaidzik VI, Paschka P, Roberts ND, et al. Genomic classification and prognosis in acute myeloid leukemia. N Engl J Med. 2016;374:2209–2221. - PMC - PubMed
    1. Patel JP, Gönen M, Figueroa ME, Fernandez H, Sun Z, Racevskis J, et al. Prognostic relevance of integrated genetic profiling in acute myeloid leukemia. N Engl J Med. 2012;366:1079–1089. - PMC - PubMed

Publication types