. 2018 Mar 21;8(1):4921.
doi: 10.1038/s41598-018-22989-0.

Consensus and conflict among ecological forecasts of Zika virus outbreaks in the United States

Affiliations

Consensus and conflict among ecological forecasts of Zika virus outbreaks in the United States

Colin J Carlson et al. Sci Rep. .

Abstract

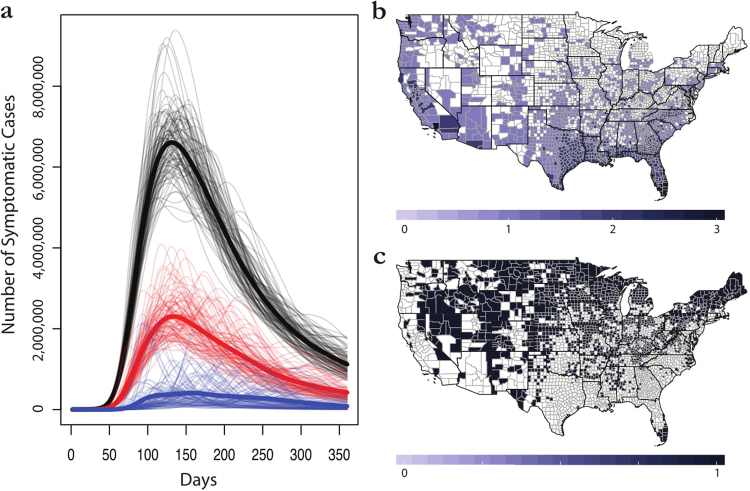
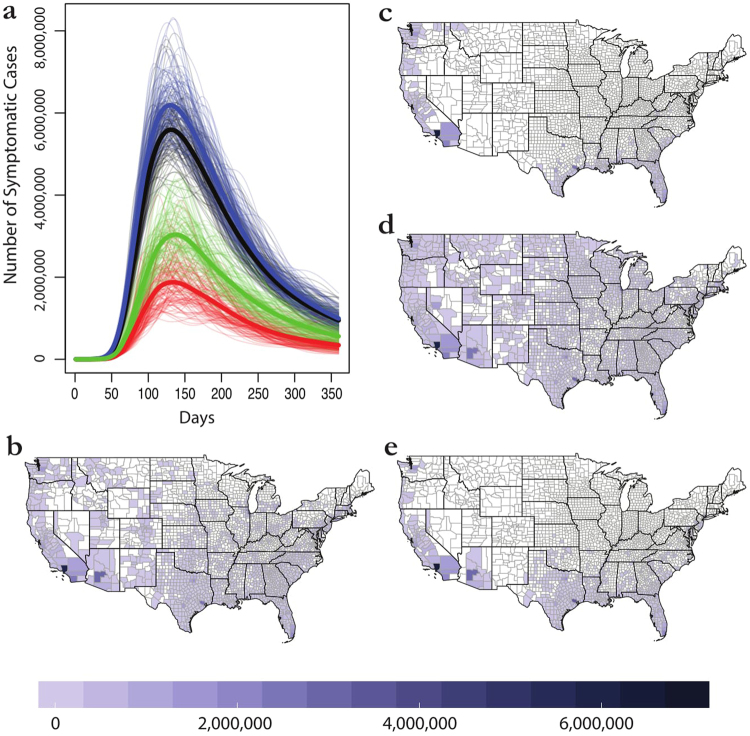
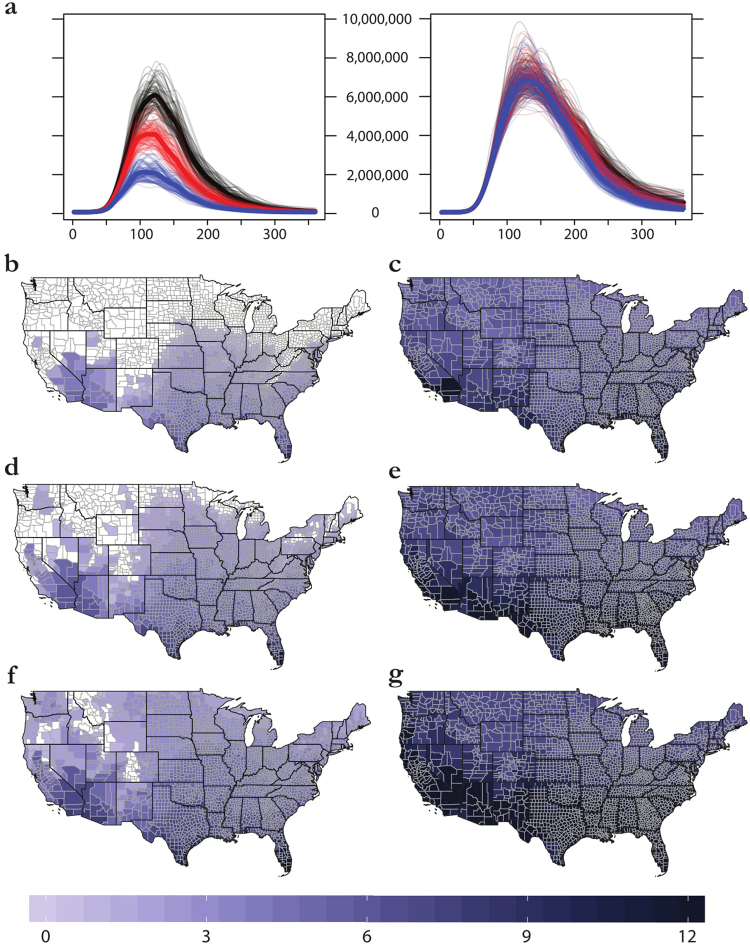
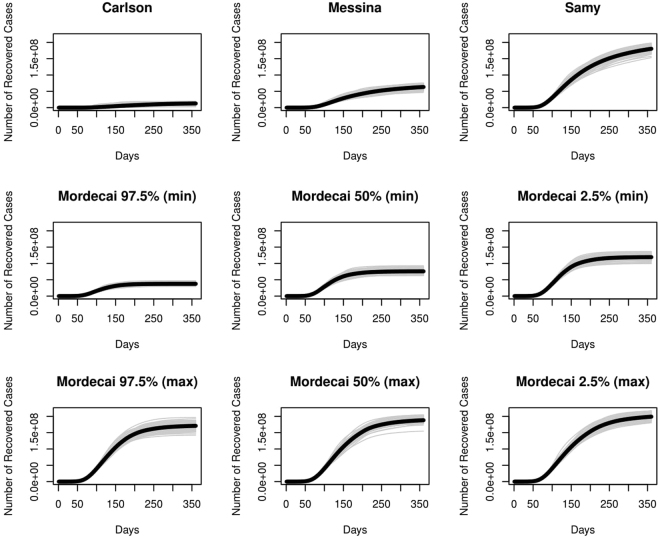
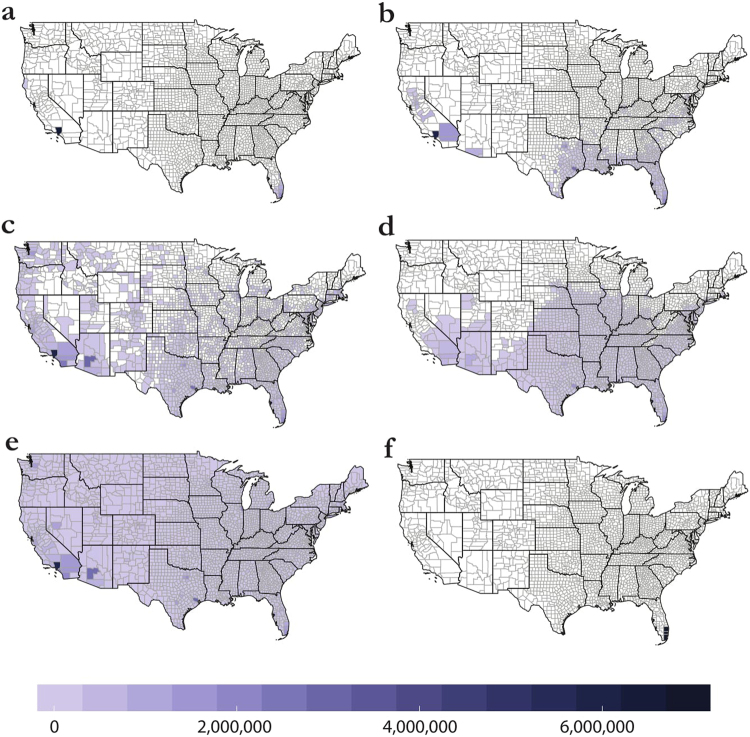
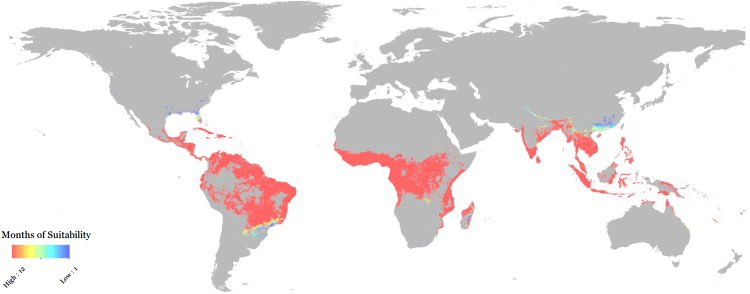
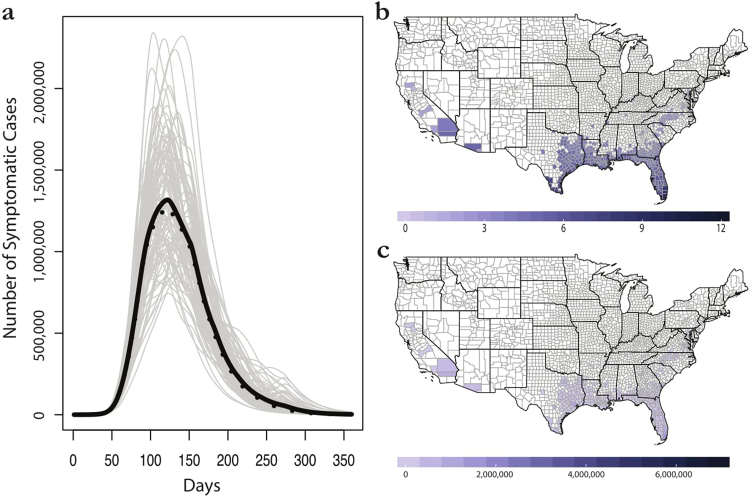
Ecologists are increasingly involved in the pandemic prediction process. In the course of the Zika outbreak in the Americas, several ecological models were developed to forecast the potential global distribution of the disease. Conflicting results produced by alternative methods are unresolved, hindering the development of appropriate public health forecasts. We compare ecological niche models and experimentally-driven mechanistic forecasts for Zika transmission in the continental United States. We use generic and uninformed stochastic county-level simulations to demonstrate the downstream epidemiological consequences of conflict among ecological models, and show how assumptions and parameterization in the ecological and epidemiological models propagate uncertainty and produce downstream model conflict. We conclude by proposing a basic consensus method that could resolve conflicting models of potential outbreak geography and seasonality. Our results illustrate the usually-undocumented margin of uncertainty that could emerge from using any one of these predictions without reservation or qualification. In the short term, ecologists face the task of developing better post hoc consensus that accurately forecasts spatial patterns of Zika virus outbreaks. Ultimately, methods are needed that bridge the gap between ecological and epidemiological approaches to predicting transmission and realistically capture both outbreak size and geography.


Conflict of interest statement

The authors declare no competing interests.

Figures

Figure 1
Figure 1
The margin of error in ecological niche models for Zika virus. (a) Average epidemiological forecasts associated with county data for Carlson (blue), Messina (red), and Samy (black), against a backdrop of overlapping individual simulations for each (grey). (b) The individual predictions of each model are given as presence or absence values; a maximum score of 3 indicates all models agree on presence, while a score of 0 indicates all models agree on absence. (c) Has consensus been achieved? At the county scale, dark blue indicates consensus among niche models; white indicates controversy. Maps were made in R 3.3.2 (https://www.R-project.org), using U.S. Census shapefiles.
Figure 2
Figure 2
Variation within the Samy models. Outbreak trajectories are shown in (a) for models 1 (red), 2 (blue), 3 (green), and 4 (black). Bolded lines are mean trajectories. Final average case totals are then mapped for model 4 (b), the main model we discuss in the text and use in other comparisons, as well as models 1 (c), 2 (d), and 3 (e). Maps were made in R 3.3.2 (https://www.R-project.org), using U.S. Census shapefiles.
Figure 3
Figure 3
The margin of error within a single Bayesian mechanistic model for Zika virus, applied to minimum (left) and maximum (right) monthly temperatures. (a) 100 outbreak simulations for 97.5% (blue), 50% (red), and 2.5% (black) confidence intervals. (bf) The number of months each county is predicted to be suitable for Zika virus transmission (R0 > 0) for 97.5% (b,c), 50% (d,e), and 2.5% (f,g) scenarios. Maps were made in R 3.3.2 (https://www.R-project.org), using U.S. Census shapefiles.
Figure 4
Figure 4
Nine possible trajectories for outbreaks in the United States: three based on ecological niche models, and six based on Bayesian mechanistic forecasts. (y-axis on log scale).
Figure 5
Figure 5
Case totals by county for (a) Carlson, (b) Messina, (c) Samy, (d), Mordecai 97.5% confidence (minimum temperatures), and (e) Mordecai 2.5% confidence (max temperatures), compared against (f) counties with reported autochthonous transmission in 2016 (three in Florida, one in Texas). Maps were made in R 3.3.2 (https://www.R-project.org), using U.S. Census shapefiles.
Figure 6
Figure 6
A global, consensus-based, seasonal (monthly) majority rule map of suitability for Zika virus transmission. Map was made with ArcMap 10.
Figure 7
Figure 7
The seasonal majority rule method for consensus building across ecological forecasts. (a) Mean (black) and median (dashed) trajectories for 100 epidemic simulations. (b) The majority rule map: shading represents the number of months each county is marked suitable for outbreaks. (c) Final average case totals in the seasonal majority rule method. Maps were made in R 3.3.2 (https://www.R-project.org), using U.S. Census shapefiles.

References

    1. Morse SS, et al. Prediction and prevention of the next pandemic zoonosis. The Lancet. 2012;380:1956–1965. doi: 10.1016/S0140-6736(12)61684-5. - DOI - PMC - PubMed
    1. Jetten TH, Focks DA. Potential changes in the distribution of dengue transmission under climate warming. The American journal of tropical medicine and hygiene. 1997;57:285–297. doi: 10.4269/ajtmh.1997.57.285. - DOI - PubMed
    1. Escobar, L. E. & Craft, M. E. Advances and limitations of disease biogeography using ecological niche modeling. Frontiers in Microbiology7 (2016). - PMC - PubMed
    1. Hernandez PA, Graham CH, Master LL, Albert DL. The effect of sample size and species characteristics on performance of different species distribution modeling methods. Ecography. 2006;29:773–785. doi: 10.1111/j.0906-7590.2006.04700.x. - DOI
    1. Segurado P, Araujo MB. An evaluation of methods for modelling species distributions. Journal of Biogeography. 2004;31:1555–1568. doi: 10.1111/j.1365-2699.2004.01076.x. - DOI

Publication types