Review
. 2018 May;19(5):255-268.
doi: 10.1038/nrn.2018.20. Epub 2018 Mar 22.

Cortical travelling waves: mechanisms and computational principles

Affiliations
Review

Cortical travelling waves: mechanisms and computational principles

Lyle Muller et al. Nat Rev Neurosci. 2018 May.

Abstract

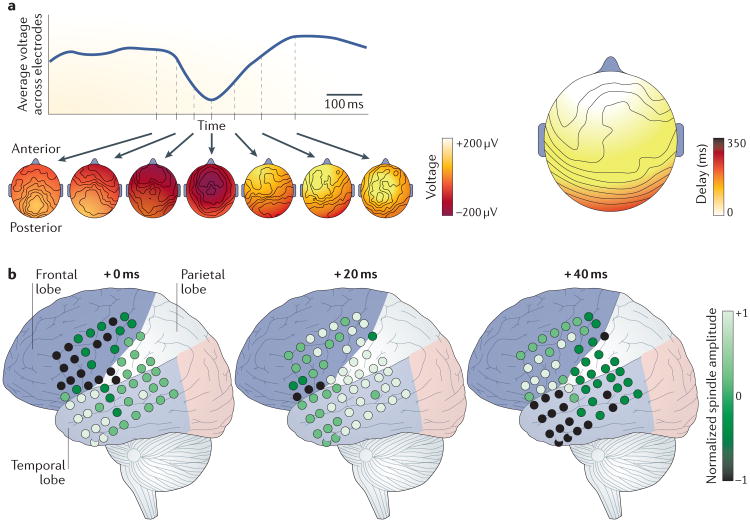
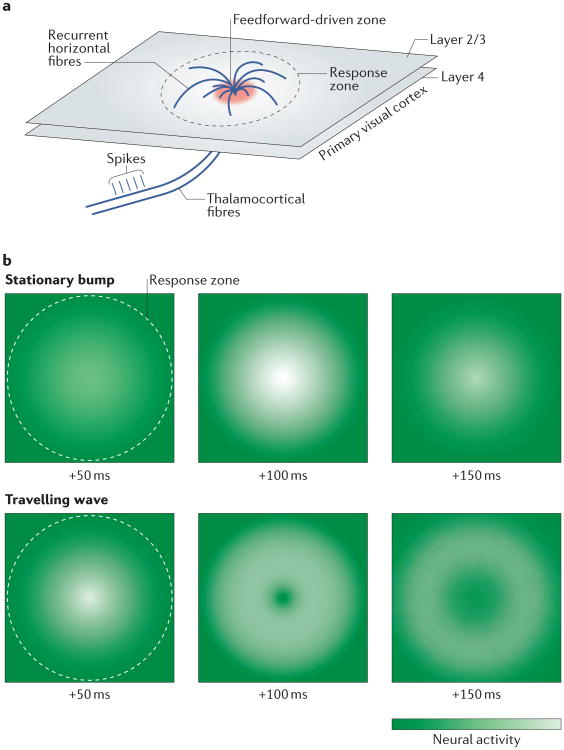
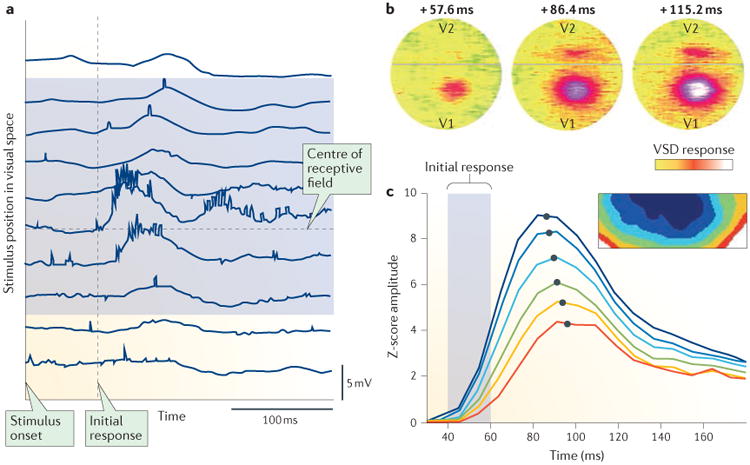
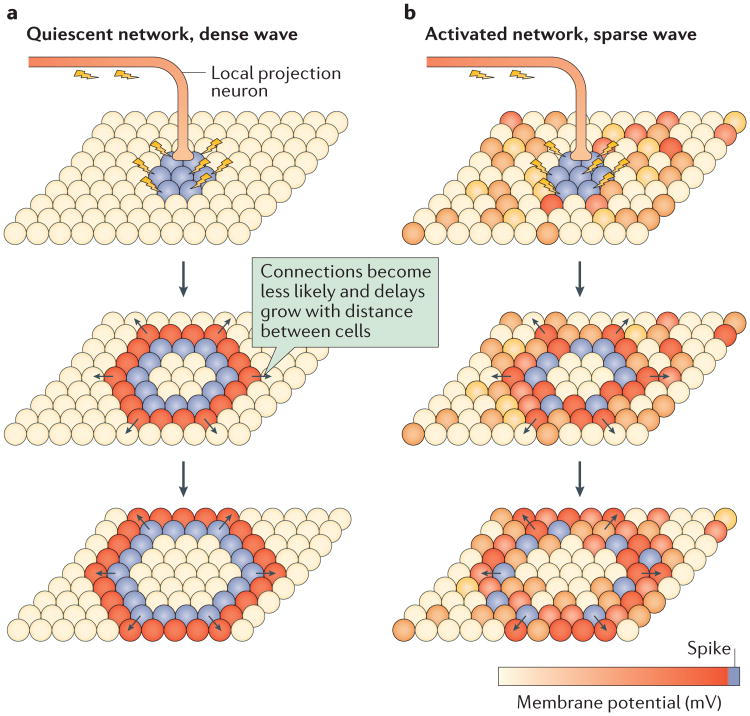
Multichannel recording technologies have revealed travelling waves of neural activity in multiple sensory, motor and cognitive systems. These waves can be spontaneously generated by recurrent circuits or evoked by external stimuli. They travel along brain networks at multiple scales, transiently modulating spiking and excitability as they pass. Here, we review recent experimental findings that have found evidence for travelling waves at single-area (mesoscopic) and whole-brain (macroscopic) scales. We place these findings in the context of the current theoretical understanding of wave generation and propagation in recurrent networks. During the large low-frequency rhythms of sleep or the relatively desynchronized state of the awake cortex, travelling waves may serve a variety of functions, from long-term memory consolidation to processing of dynamic visual stimuli. We explore new avenues for experimental and computational understanding of the role of spatiotemporal activity patterns in the cortex.


Figures

Figure 1
Figure 1. Macroscopic waves during human sleep
a | The slow oscillation of deep non-rapid-eye-movement (non-REM) sleep has been reported to be a travelling wave that moves globally from anterior to posterior regions. The upper left panel represents the time course of one slow oscillation averaged across electroencephalogram (EEG) channels. The lower left panels illustrate the evolution of voltages across the scalp at different times during the slow wave. At the start of the slow oscillation, negative EEG potentials begin in anterior sections of the scalp, and as the oscillation progresses, these travel to posterior regions. The negative peak of the slow oscillation is delayed in posterior regions by hundreds of milliseconds, reflecting the propagation time of the travelling wave (right panel). b | Sleep ‘spindles’ are 11–15 Hz oscillations that occur during stage 2 non-REM sleep and have long been known to be important for learning and memory. These spindles systematically travel as global rotating waves from the temporal to the parietal to the frontal cortex (and are therefore called TPF waves) in intracranial electrocorticography (ECoG) recordings. The panels illustrate the normalized spindle amplitude at each ECoG electrode (small circles) at successive points in the spindle cycle. From the start of an oscillation cycle (+0 ms), spindle amplitudes peak successively in the temporal (+0 ms), parietal (+20 ms) and frontal (+40 ms) lobes. The amplitudes recorded for each channel are normalized to their maximum amplitude. Part a is republished with permission of the Society of Neuroscience, from The sleep slow oscillation as a traveling wave. Massimini, M et al. J. Neurosci. 24 (31), 6872–6870 (2004); permission conveyed through Copyright Clearance Center, Inc. (REF. 44). Part b is adapted with permission from REF 13, eLife.
Figure 2
Figure 2. Two models for the stimulus-evoked response in the visual cortex
a | Small visual stimuli evoke spikes in a set of thalamocortical fibres targeting layer 4 of the primary visual cortex, which, in turn, synapses onto a small segment of layer 2/3 (the feedforward-driven zone). Recurrent horizontal fibres synapse widely across layer 2/3, spanning up to 8 millimetres of distance in the cortex (response zone). b | Within the response zone, the activity pattern is proposed to take two main forms: a stationary bump of activity, suggesting a relatively input-driven system, or a travelling wave, suggesting a circuit dominated by recurrent activity. Schematic diagrams indicate these hypothesized activity patterns and are based on results reported in REF. 14.
Figure 3
Figure 3. Mesoscopic waves in the visual cortex
a | These intracellular recordings of a complex cell in the cat visual cortex area V1 during anaesthesia show responses to an optimally oriented bar stimulus. The middle row is the response to stimulation in the centre of the receptive field of the cell. Response deflections become weaker and more delayed as the stimulus is presented farther away in visual space (top and bottom traces). This delay suggests that individual small visual stimuli evoke waves travelling across the retinotopic map of visual space. b | The first voltage-sensitive dye (VSD) studies in area V1 of an awake monkey exhibited only stationary bump responses to small visual stimuli, questioning the existence of travelling waves in V1 during waking states. These plots show time from stimulus onset (above) and the VSD response in V1 and V2 (coloured in intensity from yellow to red to white). c | Single-trial analysis of VSD data in V1 of an awake monkey demonstrated that the stimulus onset transient (which occurs 40-140 ms after the start of stimulus presentation) is indeed a travelling wave, which is masked in trial-averaged data. Plotted are the average amplitudes of the VSD response in regions of interest located at increasing distances from the point of afferent input (indicated by colours from blue to red, as shown in inset box). The dark blue region contains the afferent input zone. Evoked amplitudes show increasing temporal offset in both the initial (40-60 ms) and peak (80-100 ms) response. Grey dots represent interpolated maxima illustrating the temporal offset in the peak response. Part a is adapted with permission from REF. 67, AAAS. Part b is adapted with permission from Slovin, H. et al. Long-term voltage-sensitive dye imaging reveals cortical dynamics in behaving monkeys. J. Neurophysiol. 88, 3421–3438 (2002) (REF 68). Part c is adapted from REF 14, Macmillan Publishers Limited.
Figure 4
Figure 4. Two models for the generation of mesoscopic travelling waves
Two schematic models for wave generation in topographic networks of neurons with local, random connections and linearly increasing axonal conduction delays are illustrated. Spheres represent neurons whose membrane potential is indicated by colour. a | In a cortical network with no background activity (as observed in deep anaesthesia or often in cortical slices in vitro), we hypothesize that local stimulation will elicit strong travelling waves, which recruit nearly all cells as they pass. Arrows indicate directions of wave propagation. b | In a cortical network with strong background activity (as observed in normal waking states), we hypothesize that local stimulation can elicit waves that weakly entrain neuronal spiking as they travel across the network.
Figure 5
Figure 5. Patterning of place field firing by hippocampal travelling waves
a | The 6–12 Hz hippocampal theta oscillation, which appears during active behavioural exploration and rapid-eye-movement sleep, is a wave travelling from dorsal to ventral hippocampal CA1 (REFS 17,18). This flattened map view of the rodent hippocampus shows the positions of the dentate gyrus (DG), CA3, CA1, subiculum (S) and entorhinal cortex (ENT). The phase offset of the theta oscillation is plotted in colour along the dorsoventral axis of CA1 (colour axis, bottom left). b | As the rodent runs on a linear track, pyramidal neurons in CA1 fire. These neurons exhibit place fields that become progressively larger as their location in CA1 changes from dorsal to ventral regions,. The schematic illustrates a typical example of the place fields of neurons that fire when the rodent is at a particular spatial location during the run and is based on data in REF 17. The place fields are arranged according to their location in CA1 and with their colour illustrating the phase offset of the theta oscillation at that location on the dorsoventral axis. c | Because of the phase offset of the theta local field potential (LFP; as recorded in stratum pyramidale18; shown as light transparent lines) owing to the travelling wave (represented by the distance between the dotted lines) and the modulation of neuronal firing by theta (solid lines), neurons with CA1 place fields centred at the rodent's position fire in a temporal sweep from those with the smallest scales of spatial selectivity to those with the largest scales of spatial selectivity. Part a is reproduced from REF. 17, Macmillan Publishers Limited. Part c is adapted with permission from REF. 18, Elsevier.
Figure 6
Figure 6. Computation with cortical waves
a | A droplet emits travelling radial waves as it bounces and creates a trajectory (white arrow) across the surface of a silicone oil bath (left panel). As it bounces, the droplet creates a forward trajectory (blue line, right panel). The x axis, y axis and z axis represent the position of the droplet in space. With a simple manipulation, or introduced shift (a higher bounce, black line), the droplet can reverse its trajectory (red line), illustrating that the evoked wave field stores information about the recent past. b | Schematic models of standing bumps and travelling waves evoked by an external stimulus (red dot) are shown. As time increases (from 1 to 4 time units (t)), the standing bump reaches a steady pattern, whereas the travelling wave continues to expand across the network. It is therefore hypothesized that time from stimulus onset can be decoded in the case of travelling waves but not standing bumps. c | It is hypothesized that two sparse waves interacting in the cortex will weakly interact, passing through each other (unlike dense waves) and creating a global wave field with excitations that are symmetric about each stimulated point. Part a is adapted with permission from REF. 155. Copyrighted by the American Physical Society.

Similar articles

Cited by

References

    1. von der Malsburg C. The Correlation Theory of Brain Function. Max-Planck-Institute for Biophysical Chemistry; Gottingen, Germany: 1981.
    1. Gray CM, Singer W. Stimulus-specific neuronal oscillations in orientation columns of cat visual cortex. Proc Natl Acad Sci USA. 1989;86:1698–1702. - PMC - PubMed
    1. Salinas E, Sejnowski TJ. Correlated neuronal activity and the flow of neural information. Nat Rev Neurosci. 2001;2:539–550. - PMC - PubMed
    1. Akam T, Kullmann DM. Oscillations and filtering networks support flexible routing of information. Neuron. 2010;67:308–320. - PMC - PubMed
    1. Swadlow HA, Beloozerova IN, Sirota MG. Sharp, local synchrony among putative feed-forward inhibitory interneurons of rabbit somatosensory cortex. J Neurophysiol. 1998;79:567–582. - PubMed

Publication types