. 2018 Mar 21;9(1):1171.
doi: 10.1038/s41467-018-03505-4.

A bright organic NIR-II nanofluorophore for three-dimensional imaging into biological tissues

Affiliations

A bright organic NIR-II nanofluorophore for three-dimensional imaging into biological tissues

Hao Wan et al. Nat Commun. .

Abstract

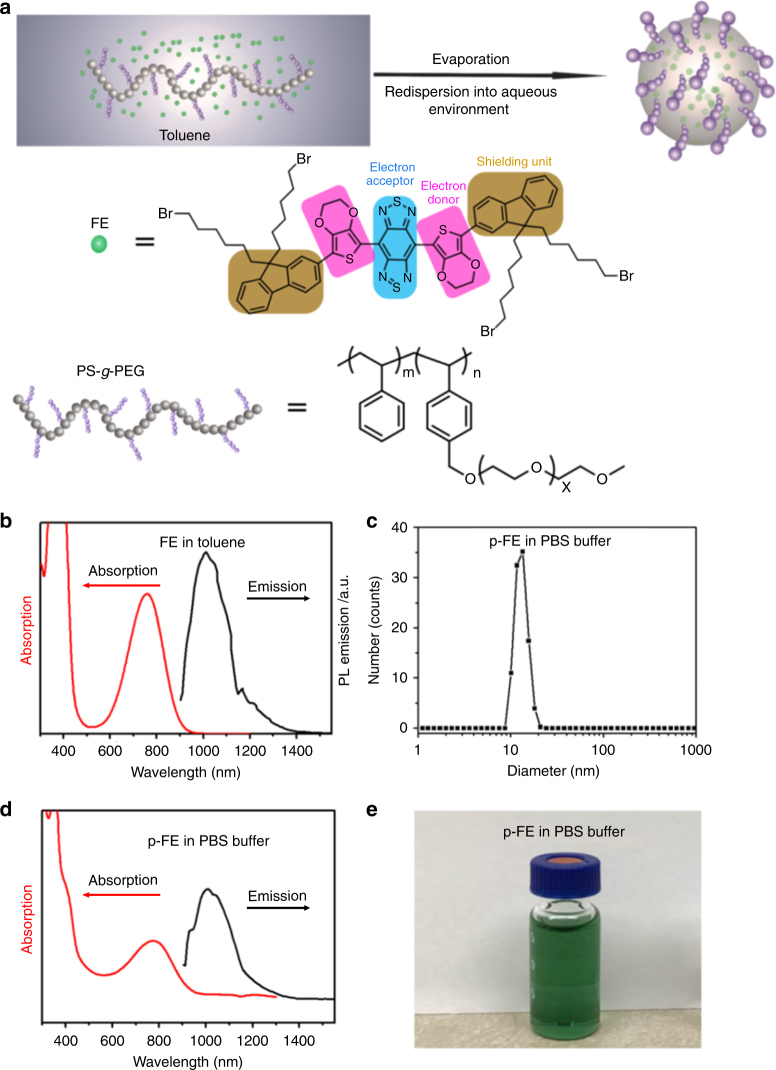
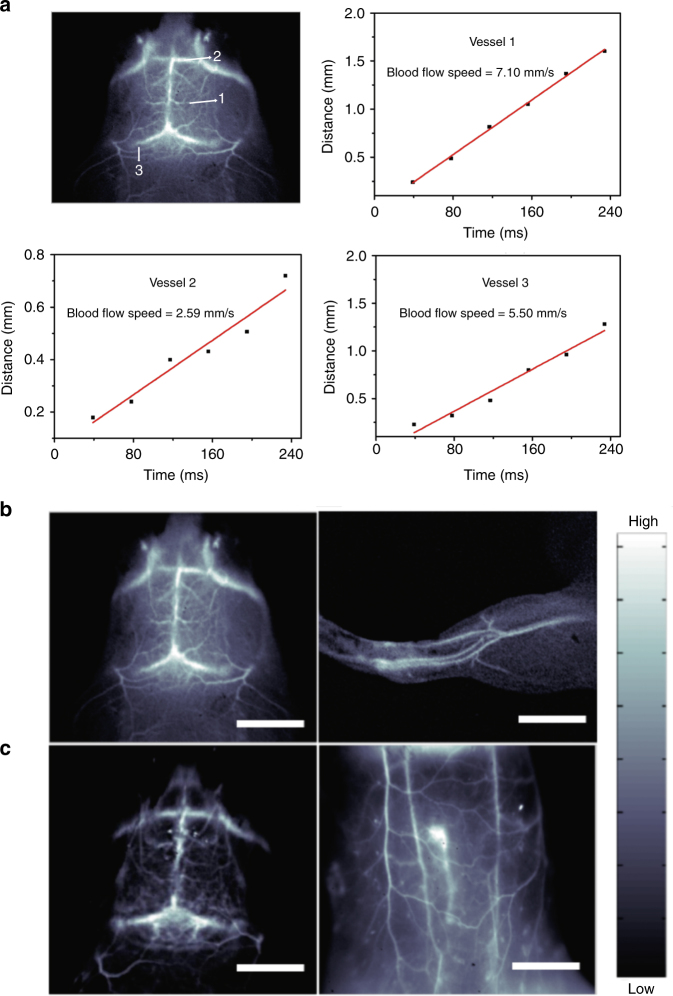
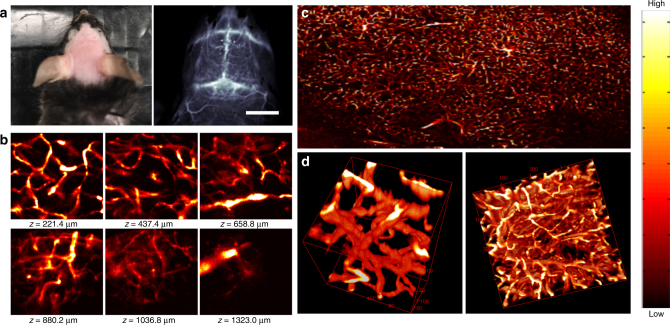
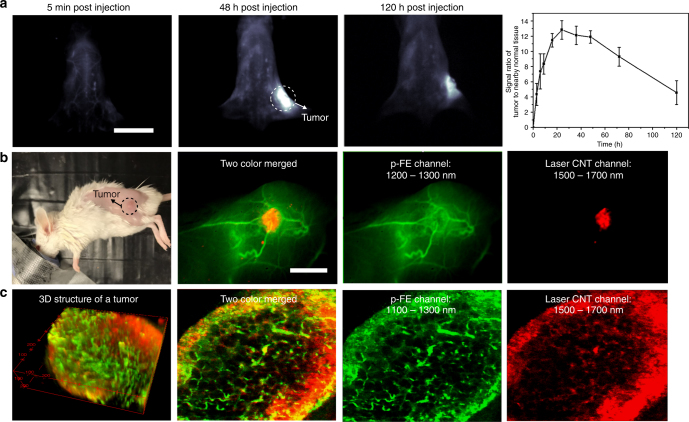
Fluorescence imaging of biological systems in the second near-infrared (NIR-II, 1000-1700 nm) window has shown promise of high spatial resolution, low background, and deep tissue penetration owing to low autofluorescence and suppressed scattering of long wavelength photons. Here we develop a bright organic nanofluorophore (named p-FE) for high-performance biological imaging in the NIR-II window. The bright NIR-II >1100 nm fluorescence emission from p-FE affords non-invasive in vivo tracking of blood flow in mouse brain vessels. Excitingly, p-FE enables one-photon based, three-dimensional (3D) confocal imaging of vasculatures in fixed mouse brain tissue with a layer-by-layer imaging depth up to ~1.3 mm and sub-10 µm high spatial resolution. We also perform in vivo two-color fluorescence imaging in the NIR-II window by utilizing p-FE as a vasculature imaging agent emitting between 1100 and 1300 nm and single-walled carbon nanotubes (CNTs) emitting above 1500 nm to highlight tumors in mice.


Conflict of interest statement

The authors declare no competing interests.

Figures

Fig. 1
Fig. 1
Synthesis and characterization of p-FE. a Scheme of p-FE synthesis and chemical structures of FE and the PS-g-PEG polymer. b Absorption and emission spectra (excited by an 808 nm laser) of FE in toluene. c Dynamic light scattering (DLS) analysis of p-FE in PBS buffer. d Absorption and emission spectra (excited by an 808 nm laser) of p-FE in PBS buffer. e Photo of p-FE dispersed in PBS buffer. Mw of PS-g-PEG is around 23000 g moL−1
Fig. 2
Fig. 2
Non-invasive real-time in vivo fluorescence imaging of mice intravenously injected with p-FE. a Ultra-fast imaging of blood flow in brain vessels of a mouse injected with p-FE with low exposure time of 2 ms through collection of fluorescence emitting above 1100 nm. b, c High-magnification fluorescence imaging of brain, hindlimb, and belly of the mouse through collection of fluorescence emitting above 1100 nm with low exposure time of 2 ms (b) and above 1300 nm with exposure time of 20 ms (c). Scale bars in Fig. 2b represent 6 mm and scale bars in Fig. 2c represent 6 and 10 mm, respectively
Fig. 3
Fig. 3
Ex vivo confocal imaging of brain vasculatures of a mouse injected with p-FE. a Photo and wide-field NIR-II epi-fluorescence imaging of brain in a mouse injected with p-FE (808 nm excitation, emission >1200 nm) with exposure time of 5 ms. bd Ex vivo confocal imaging of brain in a mouse injected with p-FE (785 nm excitation, emission >1100 nm, laser power ~30 mW, PMT voltage ~500 V). b Small area (200 × 200 µm, x × y, step size: 1 µm) and c Large area (3000 µm × 2000 µm, x × y, step size: 1 µm). The deepest area could reach ~1350 µm. d 3D reconstruction of vasculatures in brain: small area (left side, 200 µm × 200 µm × 200 µm, x × y × z, step size: 1 µm along x, y, and z directions, galvo mirror scanning, scanning speed: 2 s/frame) and large area (right side, 400 µm × 400 µm × 400 µm, x × y × z, step size: 2 µm along x and y directions, 2.7 µm along z direction, stage scanning, scanning speed 7.5 min frame−1). Scale bar represents 6 mm
Fig. 4
Fig. 4
Two-color fluorescence imaging of a tumor in the NIR-II window. a Wide-field fluorescence imaging of a mouse inoculated with a 4T1 tumor through collection of fluorescence emitting from p-FE above 1300 nm with exposure time of 5 ms and variation of T/NT signal ratio as a function of time (n = 3). b High-magnification fluorescence imaging of a mouse inoculated with a 4T1 tumor using two colors in the NIR-II window. c Confocal imaging of a tumor using two colors in the NIR-II window. 740 µm  × 740 µm × 220 µm area, step size: 2 µm along x and y directions, 5.4 µm along z direction. Laser power ~30 mW, PMT voltage: 500 V for p-FE channel and 600 V for laser CNT channel, scanning speed 15 min/frame. Pin hole: 150 µm for p-FE and 300 µm for laser CNT channel. Wavelength range: 1100–1300 nm for p-FE channel and 1500–1700 nm for laser CNT channel. Scale bars in Figs 1a and 2b represent 2 cm and 6 mm, respectively. Error bars correspond to standard deviation
Fig. 5
Fig. 5
Evaluation of pharmacokinetics and biocompatibility of p-FE (n = 3 mice/group). a Time course of blood concentration in 92 h. Fluorescence signal decreased from 77.31 to 9.91%, with a long blood circulation half-life time of ~16 h and corresponding fluorescence images of blood samples. b Biodistribution of main organs of p-FE-treated mice after 24 h post injection. c Body weight of p-FE-treated mice (n = 6 mice/ group) over a period of time of 23 days and the excretion behavior of p-FE. Error bars correspond to standard deviation

References

    1. Hong G, et al. Carbon nanomaterials for biological imaging and nanomedicinal therapy. Chem. Rev. 2015;115:10816–10906. doi: 10.1021/acs.chemrev.5b00008. - DOI - PubMed
    1. Hong G, et al. Near-infrared II fluoresence for imaging hindlimb vessel regeneration with dynamic tissue perfusion measurement. Circ. Cardiovasc. Imaging. 2014;7:517–525. doi: 10.1161/CIRCIMAGING.113.000305. - DOI - PMC - PubMed
    1. Hong G, et al. Near-infrared fluorophores for biomedical imaging. Nat. Biomed. Eng. 2017;1:0010. doi: 10.1038/s41551-016-0010. - DOI
    1. Kim Y, et al. Selection of quantum dot wavelength for biomedical assays and imaging. Mol. Imaging. 2003;2:50–64. doi: 10.1162/153535003765276282. - DOI - PubMed
    1. Yang, Q. et al. Rational design of molecular fluorophores for biological imaging in the NIR-II window. Adv. Mater. 29, 1605497 (2017). - PubMed

Publication types

MeSH terms

LinkOut - more resources