

The tyrosine-kinase inhibitor sunitinib targets vascular endothelial (VE)-cadherin: a marker of response to antitumoural treatment in metastatic renal cell carcinoma
- PMID: 29563634
- PMCID: PMC5943344
- DOI: 10.1038/s41416-018-0054-5
The tyrosine-kinase inhibitor sunitinib targets vascular endothelial (VE)-cadherin: a marker of response to antitumoural treatment in metastatic renal cell carcinoma
Abstract
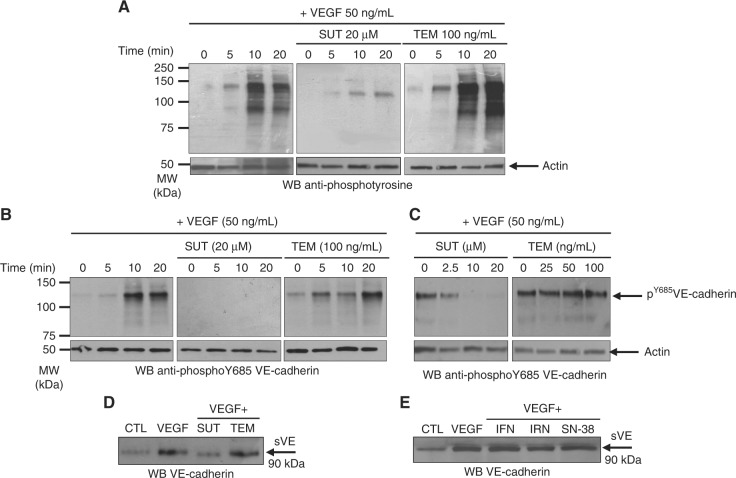
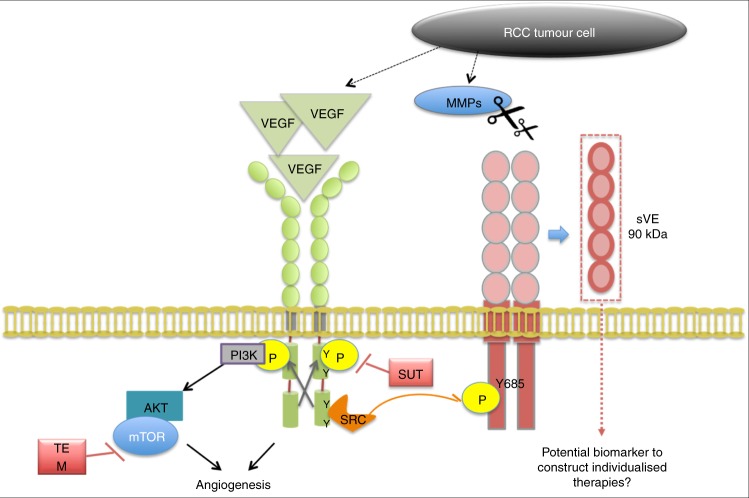
Background: Vascular endothelial (VE)-cadherin is an endothelial cell-specific protein responsible for endothelium integrity. Its adhesive properties are regulated by post-translational processing, such as tyrosine phosphorylation at site Y685 in its cytoplasmic domain, and cleavage of its extracellular domain (sVE). In hormone-refractory metastatic breast cancer, we recently demonstrated that sVE levels correlate to poor survival. In the present study, we determine whether kidney cancer therapies had an effect on VE-cadherin structural modifications and their clinical interest to monitor patient outcome.
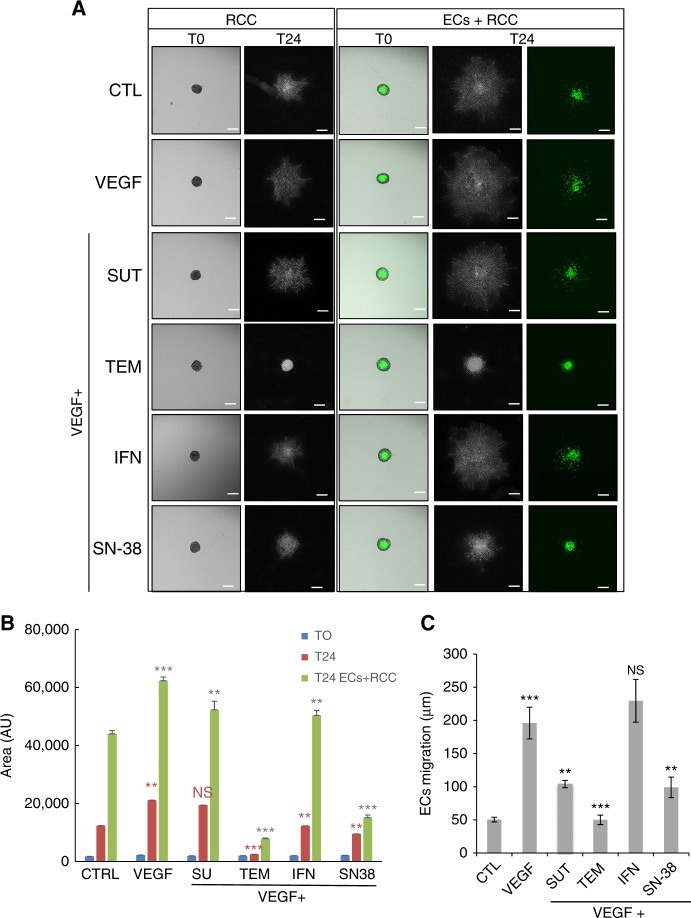
Methods: The effects of kidney cancer biotherapies were tested on an endothelial monolayer model mimicking the endothelium lining blood vessels and on a homotypic and heterotypic 3D cell model mimicking tumour growth. sVE was quantified by ELISA in renal cell carcinoma patients initiating sunitinib (48 patients) or bevacizumab (83 patients) in the first-line metastatic setting (SUVEGIL and TORAVA trials).
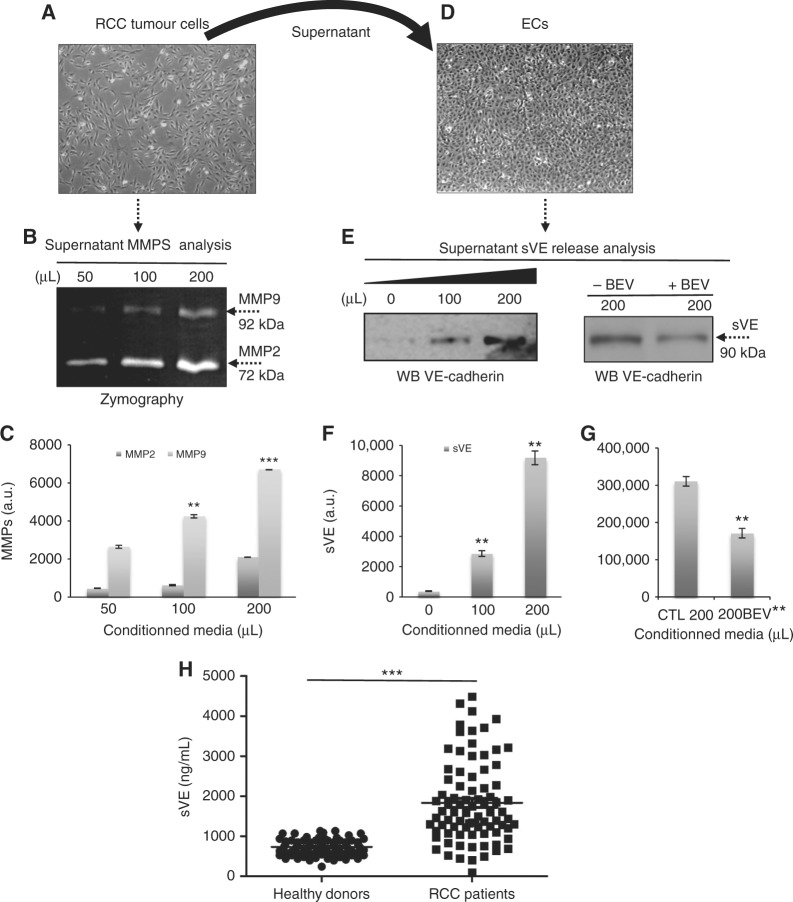
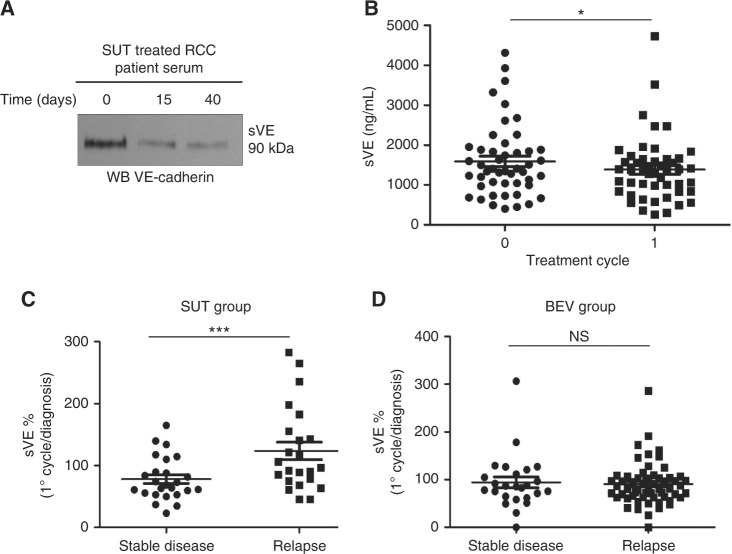
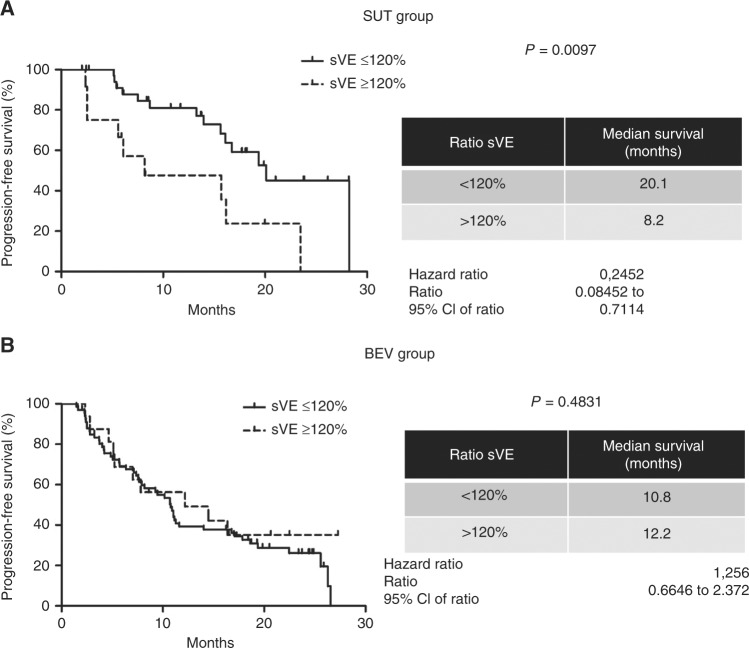
Results: Human VE-cadherin is a direct target for sunitinib which inhibits its VEGF-induced phosphorylation and cleavage on endothelial monolayer and endothelial cell migration in the 3D model. The tumour cell environment modulates VE-cadherin functions through MMPs and VEGF. We demonstrate the presence of soluble VE-cadherin in the sera of mRCC patients (n = 131) which level at baseline, is higher than in a healthy donor group (n = 96). Analysis of sVE level after 4 weeks of treatment showed that a decrease in sVE level discriminates the responders vs. non-responders to sunitinib, but not bevacizumab.
Conclusions: These data highlight the interest for the sVE bioassay in future follow-up of cancer patients treated with targeted therapies such as tyrosine-kinase inhibitors.
Trial registration: ClinicalTrials.gov NCT00619268 NCT00943839.
Conflict of interest statement
The authors declare no competing interest.
Figures
Similar articles
-
Evidence for post-translational processing of vascular endothelial (VE)-cadherin in brain tumors: towards a candidate biomarker.PLoS One. 2013 Dec 16;8(12):e80056. doi: 10.1371/journal.pone.0080056. eCollection 2013. PLoS One. 2013. PMID: 24358106 Free PMC article.
-
Tumor endothelial ELTD1 as a predictive marker for treatment of renal cancer patients with sunitinib.BMC Cancer. 2020 Apr 22;20(1):339. doi: 10.1186/s12885-020-06770-z. BMC Cancer. 2020. PMID: 32321460 Free PMC article.
-
Antitumor activity and biomarker analysis of sunitinib in patients with bevacizumab-refractory metastatic renal cell carcinoma.J Clin Oncol. 2008 Aug 1;26(22):3743-8. doi: 10.1200/JCO.2007.15.5416. J Clin Oncol. 2008. PMID: 18669461 Clinical Trial.
-
Vascular endothelial growth factor (VEGF) and VEGF receptor inhibitors in the treatment of renal cell carcinomas.Pharmacol Res. 2017 Jun;120:116-132. doi: 10.1016/j.phrs.2017.03.010. Epub 2017 Mar 19. Pharmacol Res. 2017. PMID: 28330784 Review.
-
Targeted therapies in metastatic renal cell carcinoma: overview of the past year.Curr Urol Rep. 2012 Feb;13(1):16-23. doi: 10.1007/s11934-011-0232-y. Curr Urol Rep. 2012. PMID: 22139625 Review.
Cited by
-
Retrospective efficacy analysis of olaparib combined with bevacizumab in the treatment of advanced colorectal cancer.World J Gastrointest Surg. 2023 May 27;15(5):906-916. doi: 10.4240/wjgs.v15.i5.906. World J Gastrointest Surg. 2023. PMID: 37342840 Free PMC article.
-
Renal Carcinoma and Angiogenesis: Therapeutic Target and Biomarkers of Response in Current Therapies.Cancers (Basel). 2022 Dec 14;14(24):6167. doi: 10.3390/cancers14246167. Cancers (Basel). 2022. PMID: 36551652 Free PMC article. Review.
-
Identification of miRNAs and Their Target Genes Associated with Sunitinib Resistance in Clear Cell Renal Cell Carcinoma Patients.Int J Mol Sci. 2024 Jun 22;25(13):6881. doi: 10.3390/ijms25136881. Int J Mol Sci. 2024. PMID: 38999991 Free PMC article.
-
Contribution of Blood Vessel Activation, Remodeling and Barrier Function to Inflammatory Bowel Diseases.Int J Mol Sci. 2023 Mar 14;24(6):5517. doi: 10.3390/ijms24065517. Int J Mol Sci. 2023. PMID: 36982601 Free PMC article. Review.
-
A group of novel VEGF splice variants as alternative therapeutic targets in renal cell carcinoma.Mol Oncol. 2023 Jul;17(7):1379-1401. doi: 10.1002/1878-0261.13401. Epub 2023 Apr 18. Mol Oncol. 2023. PMID: 36810959 Free PMC article.
References
-
- Afriansyah A, Hamid AR, Mochtar CA, Umbas R. Targeted therapy for metastatic renal cell carcinoma. Acta Med. Indones. 2016;48:335–347. - PubMed
Publication types
MeSH terms
Substances
Associated data
LinkOut - more resources
Full Text Sources
Other Literature Sources
Medical
