

Development and application of a machine learning algorithm for classification of elasmobranch behaviour from accelerometry data
- PMID: 29563648
- PMCID: PMC5842499
- DOI: 10.1007/s00227-018-3318-y
Development and application of a machine learning algorithm for classification of elasmobranch behaviour from accelerometry data
Abstract
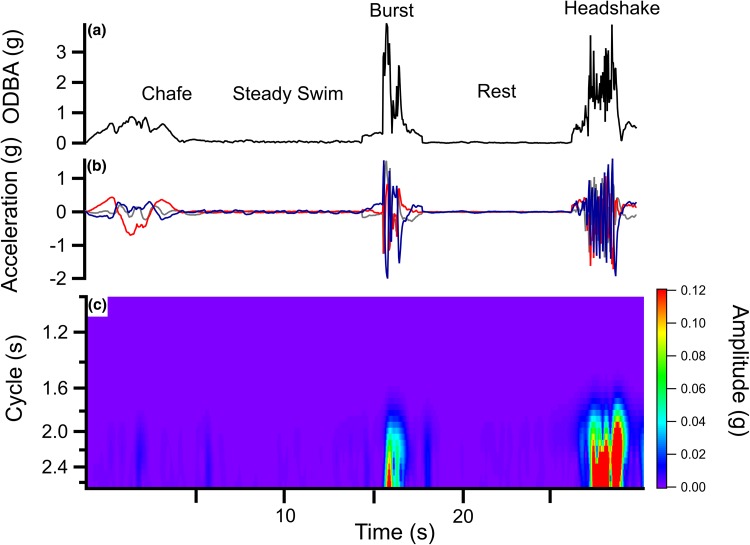
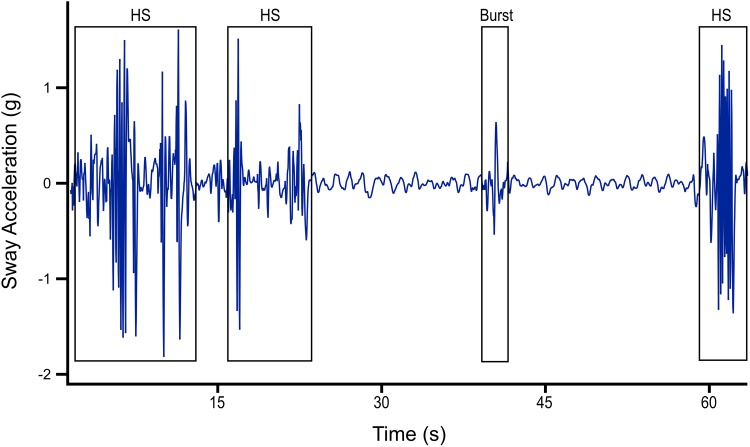
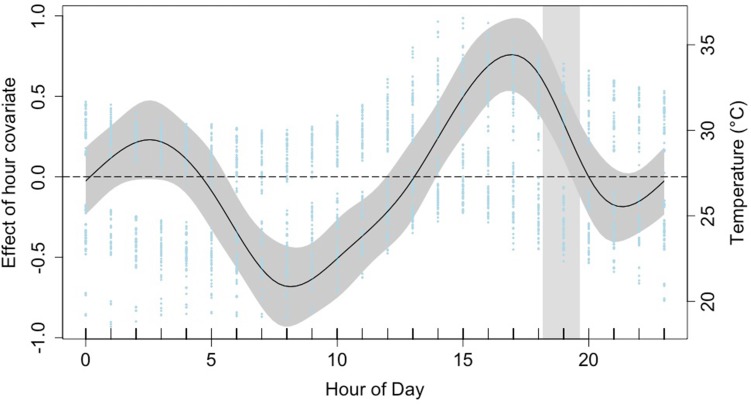
Discerning behaviours of free-ranging animals allows for quantification of their activity budget, providing important insight into ecology. Over recent years, accelerometers have been used to unveil the cryptic lives of animals. The increased ability of accelerometers to store large quantities of high resolution data has prompted a need for automated behavioural classification. We assessed the performance of several machine learning (ML) classifiers to discern five behaviours performed by accelerometer-equipped juvenile lemon sharks (Negaprion brevirostris) at Bimini, Bahamas (25°44'N, 79°16'W). The sharks were observed to exhibit chafing, burst swimming, headshaking, resting and swimming in a semi-captive environment and these observations were used to ground-truth data for ML training and testing. ML methods included logistic regression, an artificial neural network, two random forest models, a gradient boosting model and a voting ensemble (VE) model, which combined the predictions of all other (base) models to improve classifier performance. The macro-averaged F-measure, an indicator of classifier performance, showed that the VE model improved overall classification (F-measure 0.88) above the strongest base learner model, gradient boosting (0.86). To test whether the VE model provided biologically meaningful results when applied to accelerometer data obtained from wild sharks, we investigated headshaking behaviour, as a proxy for prey capture, in relation to the variables: time of day, tidal phase and season. All variables were significant in predicting prey capture, with predations most likely to occur during early evening and less frequently during the dry season and high tides. These findings support previous hypotheses from sporadic visual observations.
Conflict of interest statement
Compliance with ethical standardsThe authors declare that they have no conflict of interest.All applicable international, national, and/or institutional guidelines for the care and use of animals were followed. All procedures performed in studies involving animals were in accordance with the ethical standards of the institution or practice at which the studies were conducted (University of Miami Institutional Animal Care and Use Committee (IACUC), Protocol Number 12-030).
Figures
References
-
- Barley SC, Meekan MG, Meeuwig JJ. Species diversity, abundance, biomass, size and trophic structure of fish on coral reefs in relation to shark abundance. Mar Ecol Prog Ser. 2017;565:163–179. doi: 10.3354/meps11981. - DOI
-
- Barnett A, Payne NL, Semmens JM, Fitzpatrick R. Ecotourism increases the field metabolic rate of whitetip reef sharks. Biol Conserv. 2016;199:132–136. doi: 10.1016/j.biocon.2016.05.009. - DOI
-
- Battaile BC, Sakamoto KQ, Nordstrom CA, Rosen DA, Trites AW. Accelerometers identify new behaviors and show little difference in the activity budgets of lactating northern fur seals (Callorhinus ursinus) between breeding islands and foraging habitats in the Eastern Bering Sea. PLoS One. 2015;10:e0118761. doi: 10.1371/journal.pone.0118761. - DOI - PMC - PubMed
-
- Bidder OR, Campbell HA, Gómez-Laich A, Urgé P, Walker J, Cai Y, Gao L, Quintana F, Wilson RP. Love thy neighbour: automatic animal behavioural classification of acceleration data using the k-nearest neighbour algorithm. PLoS One. 2014;9:e88609. doi: 10.1371/journal.pone.0088609. - DOI - PMC - PubMed
LinkOut - more resources
Full Text Sources
Other Literature Sources