. 2018 Mar 7:9:179.
doi: 10.3389/fphys.2018.00179. eCollection 2018.

Human-Human Interaction Forces and Interlimb Coordination During Side-by-Side Walking With Hand Contact

Affiliations

Human-Human Interaction Forces and Interlimb Coordination During Side-by-Side Walking With Hand Contact

Francesca Sylos-Labini et al. Front Physiol. .

Abstract

Handholding can naturally occur between two walkers. When people walk side-by-side, either with or without hand contact, they often synchronize their steps. However, despite the importance of haptic interaction in general and the natural use of hand contact between humans during walking, few studies have investigated forces arising from physical interactions. Eight pairs of adult subjects participated in this study. They walked on side-by-side treadmills at 4 km/h independently and with hand contact. Only hand contact-related sensory information was available for unintentional synchronization, while visual and auditory communication was obstructed. Subjects walked at their natural cadences or following a metronome. Limb kinematics, hand contact 3D interaction forces and EMG activity of 12 upper limb muscles were recorded. Overall, unintentional step frequency locking was observed during about 40% of time in 88% of pairs walking with hand contact. On average, the amplitude of contact arm oscillations decreased while the contralateral (free) arm oscillated in the same way as during normal walking. Interestingly, EMG activity of the shoulder muscles of the contact arm did not decrease, and their synergistic pattern remained similar. The amplitude of interaction forces and of trunk oscillations was similar for synchronized and non-synchronized steps, though the synchronized steps were characterized by significantly more regular orientations of interaction forces. Our results further support the notion that gait synchronization during natural walking is common, and that it may occur through interaction forces. Conservation of the proximal muscle activity of the contact (not oscillating) arm is consistent with neural coupling between cervical and lumbosacral pattern generation circuitries ("quadrupedal" arm-leg coordination) during human gait. Overall, the findings suggest that individuals might integrate force interaction cues to communicate and coordinate steps during walking.

Keywords: EMG activity; arm-leg coordination; human gait; interaction forces; interpersonal coordination; locomotor patterns.


Figures
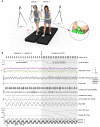
Figure 1
Figure 1
Experimental setup. (A) Schematic illustration of the experimental setup and of the force sensing device (right panel) with a load cell in the center and handles attached to each side. (B) An example of cycle duration, interaction force, kinematic parameters and EMG activity when the metronome pace provided to one of the partners was switched from f0 (natural stride frequency) to f0+20% (instant denoted by the vertical arrow). From top to bottom: metronome audio waveform sent to “partner 1” headphones, gait cycle duration of the contact side leg (left leg for partner 1 in black, right leg for partner 2 in gray), interaction force about x, y, and z axes (see panel A for axes orientation) and resultant tridimensional force magnitude (3d), vertical displacement of the contact side shoulder marker [dashed line represents the vertical distance between the shoulder markers of the two partners, diff. (Δ)], yaw angle of the upper trunk, EMG activity of posterior deltoid of the contact arm, contact and non-contact arm swing angle, contact side leg angle, average frequency difference (Δω) and phase difference (Δφ) of the contact side leg movements of the two partners. At the bottom: lower limb stance durations for each partner.
Figure 2
Figure 2
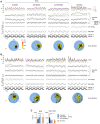
Dyad's synchronization. (A) Average (+SD) cadence expressed in stride/min (left panel) and as a percentage of the natural stride frequency (f0) of each subject (right panel) across different conditions (see Table 2 for the abbreviations). (B) Pie charts illustrating, for each condition, the percentage of subjects (n = 16), which experienced synchronized gait with the partner for at least 5.5 s (upper pies) or at least 10% of strides (lower pies). At the bottom: averaged (+SD) percent of time of synchronized (sync.) locomotion (left), percent of synchronized strides (middle) and average frequency difference of the contact side leg movements of the two partners (right) across different conditions. Asterisks denote significant (Dunnett's post-hoc test p < 0.05) differences with the normal (no contact) walking condition (NC_wn). (C) Polar histogram illustrating the distribution of the phase shift between contact side leg movements (Δφ) for the synchronized strides.
Figure 3
Figure 3
Gait kinematics and upper limb EMG patterns. (A) Ensemble averaged (mean ± SD, across subjects) kinematic and EMG patterns during walking without (left column) or with (right column) hand contact. From top to bottom: arm swing and abduction angles (black curves refer to the contact arm while light gray curves refer to the contralateral arm), roll, pitch and yaw angles of the trunk, contact side leg angle, EMG patterns of 7 muscles of the contact arm and 5 muscles of the contralateral arm. Patterns are plotted versus normalized gait cycle calculated from the contact side leg. (B) Averaged (+SD) range of motion (ROM) of the arm swing angle, ROM of the roll, pitch and yaw angles of the trunk, maximum EMG activity in the muscles of the contact arm and of the contralateral arm during walking without or with hand contact. (C) Polar plots of the center of activity (COA). Polar direction denotes the relative time of the averaged (across subjects) COA over the gait cycle (time progresses clockwise), the width of the sector denotes angular SD. (D) Basic muscle activation patterns and their clustering across different conditions. Basic patterns are plotted in a chronological order (with respect to the time of the main peak of the centroid of each cluster–displayed with a black curve). Each gray curve represents the centroid of the clusterization of the basic activation patterns for each subject. By the side of each cluster of patterns, the individual (color bars) and mean (black contour bars) muscle synergies are displayed. Asterisks (B) denote significant (Dunnett's post-hoc test p < 0.05) differences relative to the normal (no contact) walking condition. Hash tags (C) denote significant (Watson-Williams test p < 0.05) differences relative to the normal walking condition.
Figure 4
Figure 4
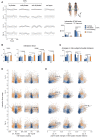
Interaction forces. (A) Ensemble averaged (mean ± SD, across strides) interaction force components about x, y, and z axes (Fx, Fy, and Fz) and tridimensional force magnitude (F3d, at the bottom) across the different modes of interpersonal coordination. From left to right: in-phase (Δφ <5% or Δφ >95%), anti-phase (45% < Δφ <55%) and out-of-phase (10% < Δφ <40% or 60% < Δφ <90%) synchronized (|Δω| < 0.0002 Hz) strides and not-synchronized (|Δω|>0.18 Hz) strides. The bar plots on the right show the averaged (+SD) percent of variance accounted for (vaf) by the 1st and the 2nd harmonics of the 3d interaction force. (B) Averaged (+SD) mean (over the 5 consecutive strides) interaction force about x, y, and z axes and its 3d magnitude (left panel) and the range of changes of the interaction force (right panels). (C) Peak-to-peak changes (mean + SD) in the inter-subject shoulder distance along the x, y, and z axes. (D) Relationship between interaction force oscillations (about x, y, and z axes and 3d) and interpersonal gait parameters (the pace difference ΔT, calculated as the difference between the durations of two concurrent strides of the partners, left column, and the phase shift Δφ between two strides [heel strikes] of the partners, right column). Each point represents a stride, the color of the points has the same denotation used for the different modes of interpersonal gait synchronization (see the legend in A) while light-gray describes points that fall outside of this classification. (E) Relationship between interaction force oscillations and the amplitude of changes in the inter-subject shoulder distance along the x, y, and z axes (Δx, Δy, and Δz columns from left to right) in the same format as in panel D. Horizontal lines in A–C denote significant (LSD post-hoc test p < 0.05) differences. Black lines in D,E indicate power function and linear fitting, respectively, that correlated (r2 > 0.05) with the data.
Figure 5
Figure 5
Variability of spatial orientation of interaction forces. (A) Examples of interaction forces and arm/leg kinematics of a representative dyad for intervals of 5 consecutive strides during different modes of interpersonal gait synchronization (from left to right): in-phase (Δφ <5% or Δφ >95%), anti-phase (45% < Δφ <55%) and out-of-phase (10% < Δφ <40% or 60% < Δφ <90%) synchronized (|Δω| < 0.0002 Hz) strides and not-synchronized (|Δω|>0.18 Hz) strides. From top to bottom: interaction forces, displacement (x, y, and z) of the contact side shoulder marker (for partner 1 in black, for partner 2 in gray, dashed line represents the difference (Δ) between the partners), yaw angle of the upper trunk, contact arm swing angle, contact side leg angle and lower limbs' stance durations for each partner. At the bottom: Spherical spatial density of the force vector directions during the corresponding 5 consecutive strides. Each point corresponds to a single sample (sample frequency 200 Hz), the color scale indicates density diagrams calculated using the Kamb method for directional data with E = 3σ and exponential smoothing (see Methods), and the black contours outline the areas with density equal to E+2σ. (B) Another example of interactions forces for another dyad (same format as in A). (C) Averaged (+SD) area of the spherical density ≥ E+2σ (left) and maximum level of the spherical density (right) during the different modes of interpersonal coordination. Horizontal lines denote significant (LSD post-hoc test p < 0.05) differences.

Similar articles

Cited by

References

    1. Balash Y., Hadar-Frumer M., Herman T., Peretz C., Giladi N., Hausdorff J. M. (2007). The effects of reducing fear of falling on locomotion in older adults with a higher level gassit disorder. J. Neural Transm. 114, 1309–1314. 10.1007/s00702-007-0771-z - DOI - PubMed
    1. Ballesteros M. L., Buchthal F., Rosenfalck P. (1965). The pattern of muscular activity during the arm swing of natural walking. Acta Physiol. Scand. 63, 296–310. 10.1111/j.1748-1716.1965.tb04069.x - DOI - PubMed
    1. Batschelet E. (1981). Circular Statistics in Biology. New York, NY: Academic Press.
    1. Berens P. (2009). CircStat: a MATLAB toolbox for circular statistics. J. Stat. Softw. 31, 1–21. 10.18637/jss.v031.i10 - DOI
    1. Cavagna G. A., Margaria R. (1966). Mechanics of walking. J. Appl. Physiol. 21, 271–278. 10.1152/jappl.1966.21.1.271 - DOI - PubMed

LinkOut - more resources