. 2018 Mar 7:9:297.
doi: 10.3389/fmicb.2018.00297. eCollection 2018.

Linking Associations of Rare Low-Abundance Species to Their Environments by Association Networks

Affiliations

Linking Associations of Rare Low-Abundance Species to Their Environments by Association Networks

Tatiana V Karpinets et al. Front Microbiol. .

Abstract

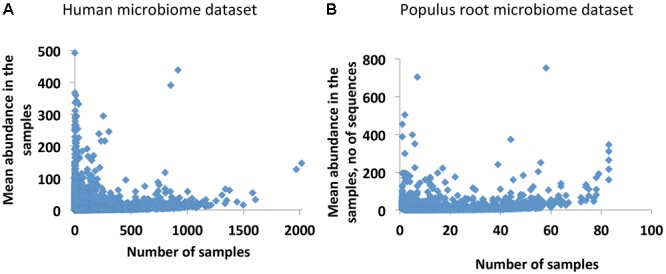
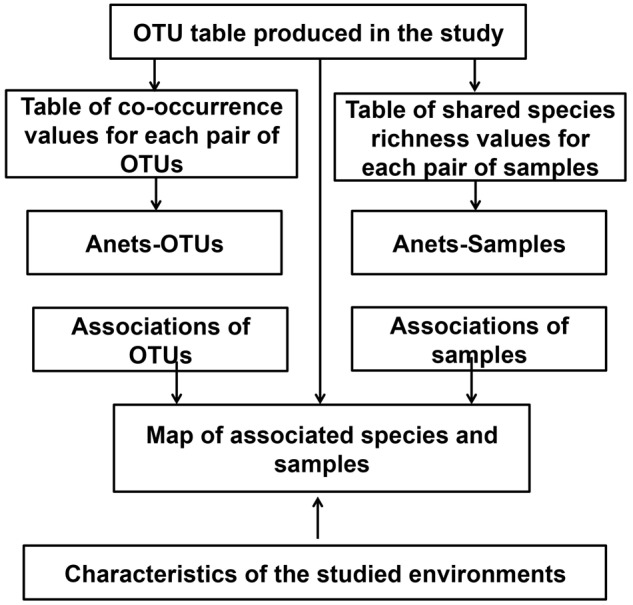
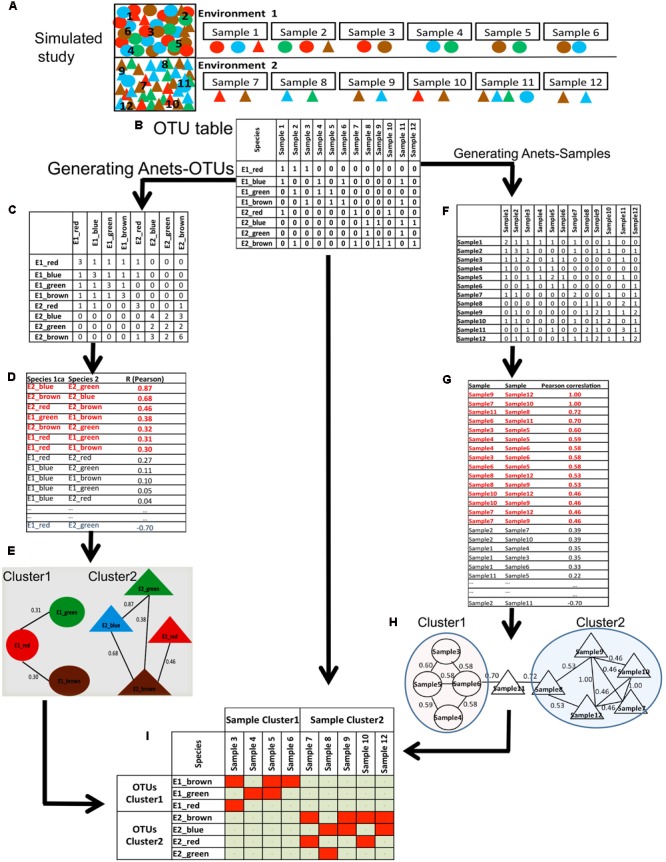
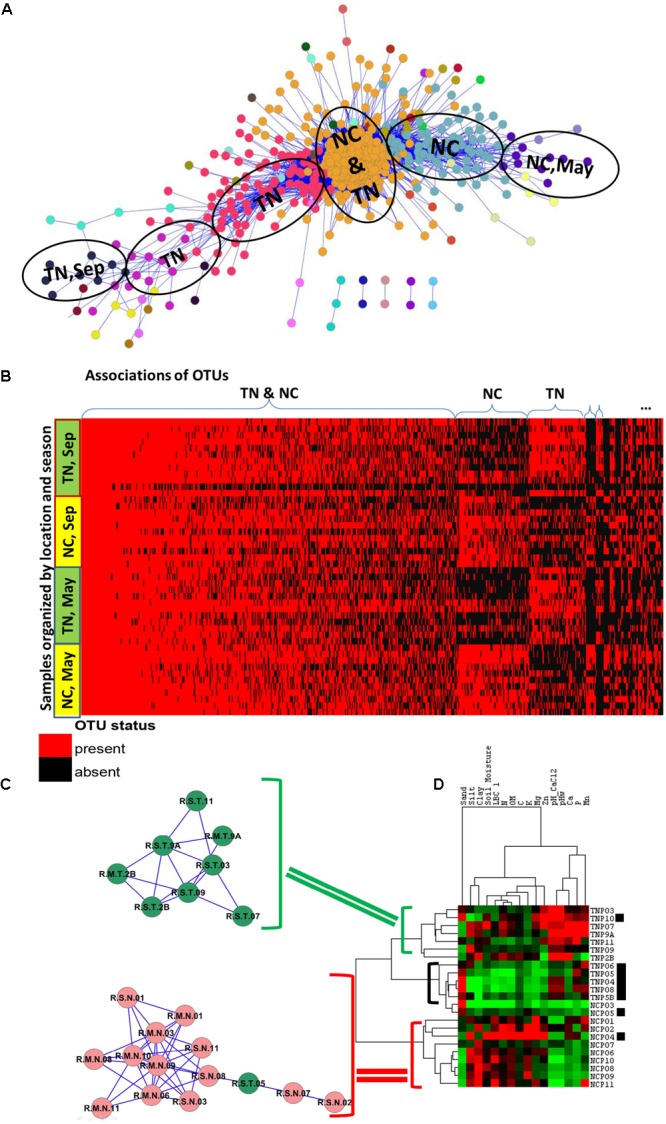
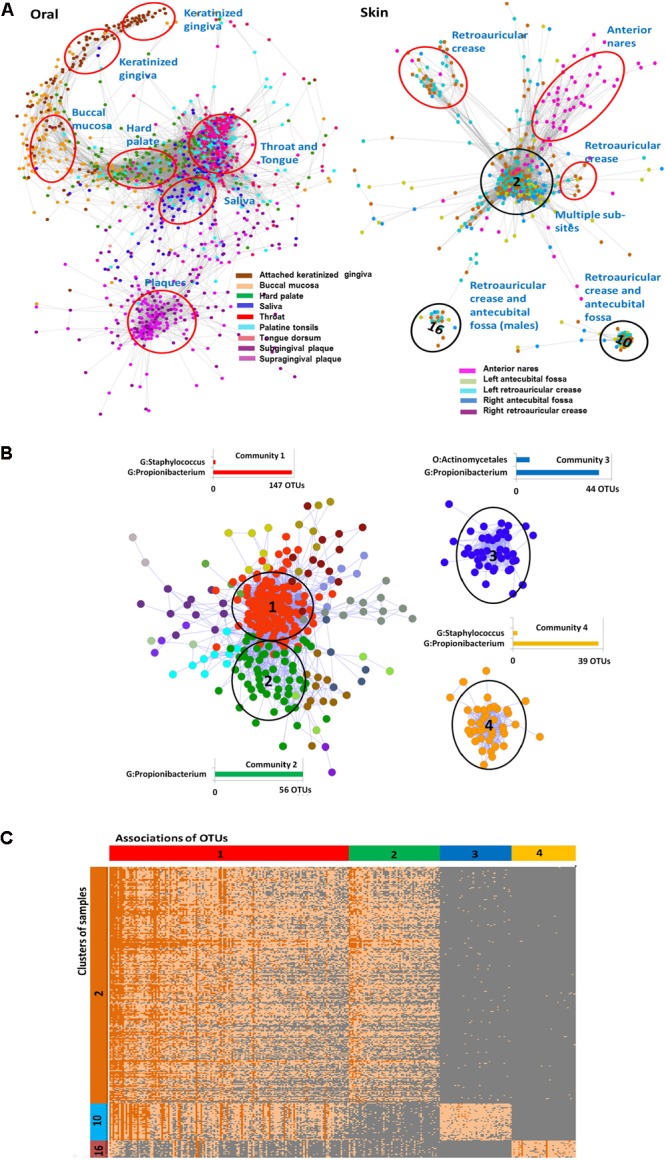
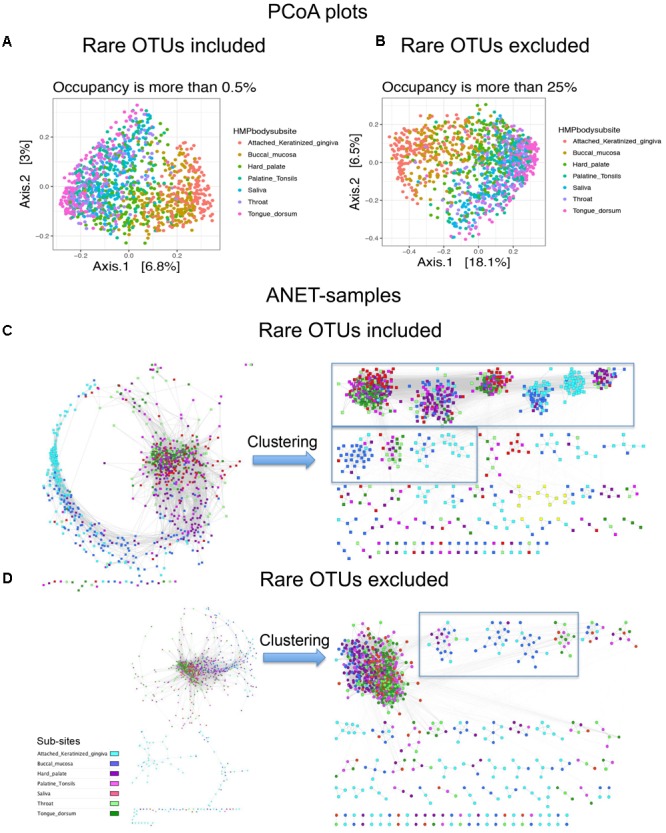
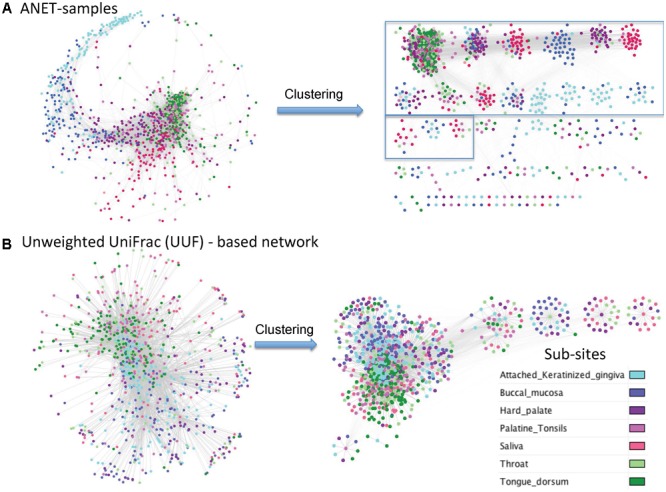
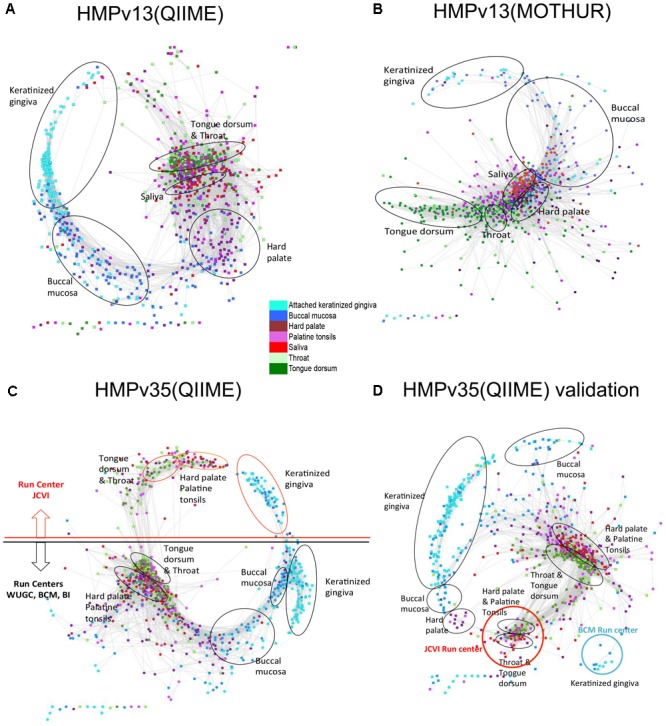
Studies of microbial communities by targeted sequencing of rRNA genes lead to recovering numerous rare low-abundance taxa with unknown biological roles. We propose to study associations of such rare organisms with their environments by a computational framework based on transformation of the data into qualitative variables. Namely, we analyze the sparse table of putative species or OTUs (operational taxonomic units) and samples generated in such studies, also known as an OTU table, by collecting statistics on co-occurrences of the species and on shared species richness across samples. Based on the statistics we built two association networks, of the rare putative species and of the samples respectively, using a known computational technique, Association networks (Anets) developed for analysis of qualitative data. Clusters of samples and clusters of OTUs are then integrated and combined with metadata of the study to produce a map of associated putative species in their environments. We tested and validated the framework on two types of microbiomes, of human body sites and that of the Populus tree root systems. We show that in both studies the associations of OTUs can separate samples according to environmental or physiological characteristics of the studied systems.

Keywords: Anets; alpha and beta diversity; metagenome; microbiome; qualitative data; sparse data; unsupervised analysis.


Figures

FIGURE 1
FIGURE 1
Occupancy–abundance relationship. (A) Human Microbiome Project (HMP) dataset (43140 OTUs × 2910 Samples). (B) Populus Root Microbiome (PRM) dataset (24434 OTUs × 83 Samples).
FIGURE 2
FIGURE 2
Computational framework used in the study to explore associations of rare species.
FIGURE 3
FIGURE 3
Generating Anets-OTUs using the simulated study. (A) A simulated study of two synthetic microbial communities: four species shown by colored (red, green, blue, brown) circles (Community 1), and four different species shown by colored (red, green, blue, brown) triangles (Community 2). The same color of the species indicates their close taxonomic relationship. To introduce noise in sampling, two species from the second community were added to the first community, and one species from the first community was added to the second community. Six samples were taken to identify species in each community and to generate an OTU table with the species abundances. (B) OTU table of the simulated study. (C) The table of co-occurrences for each pair of OTUs. Values of the table show the number of samples where each pair of species co-occurs. (D) Pair-wise similarities of the co-occurrence profiles for each pair of species. Red colored associations were used to generate Anets-OTUs. (E) Anets-OTUs. (F) The table of the shared species richness for each pair of samples. Values of the table show how many OTUs are shared for each pair of samples. (G) Pair-wise similarities of the shared species richness profiles for each pair of samples. Red colored associations were used to generate Anets-Samples. (H) Anets-Samples. (I) A map of the associated species and samples.
FIGURE 4
FIGURE 4
Associations of rare species and samples in PRM study. (A) Communities of associated fungal and bacterial OTUs discovered by the Anets-OTUs algorithm in rhizoshpere of Populus deltoides. Nodes in the network indicate OTUs and edges indicate pair-wise association between them. The node color shows the community (cluster) assignment inferred by clustering. (B) Presence–absence map of the associated OTUs; the cell color is red if OTU is present in the sample and it is black if OTU is absent. OTUs are grouped according to the microbial communities inferred by Anets-OTUs and sorted by mean abundance; samples are grouped according to clusters inferred by Anets-Samples and sorted by the shared richness. (C) Two associations of Populus rhizoshpere samples with the shared species richness revealed by Anets-Samples; color indicates samples taken in NC (red) and in TN (green). (D) Hierarchical clustering of the soil properties; brackets indicate three cluster of soil samples with distinct soil properties: green bracket indicates the cluster of soil samples that correspond to the association of rhizosphere samples in TN, red bracket indicates the cluster of soil samples that correspond to the association of rhizosphere samples in NC, black bracket and black squares indicate samples that don’t found as associated by Anets-Samples.
FIGURE 5
FIGURE 5
Associations of rare species and samples in the HMP study. (A) Associations of oral and skin samples. Samples in the networks are represented by filled circles colored according to the sampling sub sites in the HMP study. Edges between circles indicate significant association between samples in terms of the shared species richness. Red and black ovals label associations predicted by clustering of the Anets-Samples. Name of each cluster was inferred by the enrichment analysis as described in Section “Materials and Methods.” Black ovals indicate clusters (2, 10, and 16) that were further analyzed by the Anets-OTUs algorithm. (B) Associations of rare species discovered by Anets-OTUs in samples comprised clusters 2, 10, and 16. Small components of the network are not included. OTUs are represented by nodes (filled circles) where color indicates different clusters inferred by Markov clustering. The largest clusters are referred as communities. Edges between nodes represent significant associations (p < 0.001) between a pair of OTUs. They are labeled by black ovals and have associated bar charts showing the number of OTUs from most abundant taxonomic ranks labeled as G (Genus) and O (Order). (C) Heat map of abundances (in terms of sequencing reads) of associating microbial OTUs (horizontal axis) in three distinct clusters of samples (vertical axis) collected from the human skin. OTUs are grouped according to the microbial communities inferred by Anets-OTUs and sorted by mean abundance; samples are grouped according to clusters inferred by Anets-Samples and sorted by the shared richness. Each cell shows the number of OTU reads. Color of cells in the map shows the number of reads representing the OTUs in the sample: 10 reads or more (dark orange), from 1 to 10 reads (light orange), and not represented by reads (gray). Cluster IDs indicated in (A,B) are shown in vertical and horizontal bars of the heat map respectively.
FIGURE 6
FIGURE 6
Principal coordinates analysis (PCoA) plots and Anets-Samples for oral samples with or without rare OTUs. (A) PCoA plot generated by including rare OTUs. (B) PCoA plot generated by excluding rare OTUs. (C) Anets-Samples generated by including rare OTUs. (D) Anets-Samples generated by excluding rare OTUs. Large clusters (more than 10 samples) are bordered by rectangles.
FIGURE 7
FIGURE 7
Networks of oral samples and their clustering by the Markov clustering algorithm (MCL) with the same parameters. (A) The network was generated using Anets-Samples algorithm. The large clusters (more than 10 samples) are bordered by rectangles. (B) The network was generated using Unweighted UniFrac (UUF) distances as measure of pair-wise similarity of the samples (nodes) with the threshold 0.98.
FIGURE 8
FIGURE 8
Anets-Samples generated for different OTU tables comprised of oral samples. (A) OTU table generated by QIIME pipeline from sequencing of 16S rRNA gene variable regions 1–3. (B) OTU table generated by MOTHUR pipeline from sequencing of 16S rRNA gene variable regions 1–3. (C) OTU table generated by QIIME pipeline from sequencing of 16S rRNA gene variable regions 3–5. (D) OTU table generated by QIIME pipeline from sequencing of 16S rRNA gene variable regions 3–5 of a distinct set of oral samples.

References

    1. Aagaard K., Petrosino J., Keitel W., Watson M., Katancik J., Garcia N., et al. (2013). The human microbiome project strategy for comprehensive sampling of the human microbiome and why it matters. FASEB J. 27 1012–1022. 10.1096/fj.12-220806fj.12-220806 - DOI - PMC - PubMed
    1. Ashelford K. E., Chuzhanova N. A., Fry J. C., Jones A. J., Weightman A. J. (2005). At least 1 in 20 16S rRNA sequence records currently held in public repositories is estimated to contain substantial anomalies. Appl. Environ. Microbiol. 71 7724–7736. 10.1128/aem.71.12.7724-7736.2005 - DOI - PMC - PubMed
    1. Bascompte J., Jordano P., Melian C. J., Olesen J. M. (2003). The nested assembly of plant-animal mutualistic networks. Proc. Natl. Acad. Sci. U.S.A. 100 9383–9387. 10.1073/pnas.16335761001633576100 - DOI - PMC - PubMed
    1. Callahan B. J. (2017). Exact sequence variants should replace operational taxonomic units in marker-gene data analysis. ISME J. 11 2639–2643. 10.1038/ismej.2017.119 - DOI - PMC - PubMed
    1. Callahan B. J., McMurdie P. J., Rosen M. J., Han A. W., Johnson A. J. A., Holmes S. P. (2016). DADA2: high-resolution sample inference from Illumina amplicon data. Nat. Methods 13 581–583. 10.1038/Nmeth.3869 - DOI - PMC - PubMed

LinkOut - more resources