. 2018 Mar 7:9:400.
doi: 10.3389/fmicb.2018.00400. eCollection 2018.

Quantitating the Transfer of the HTLV-1 p8 Protein Between T-Cells by Flow Cytometry

Affiliations

Quantitating the Transfer of the HTLV-1 p8 Protein Between T-Cells by Flow Cytometry

Norbert Donhauser et al. Front Microbiol. .

Abstract

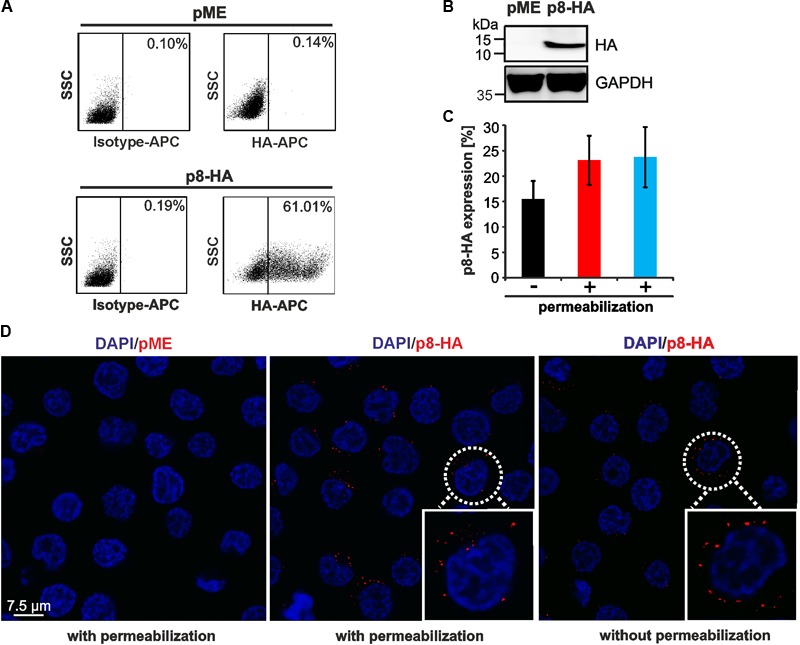
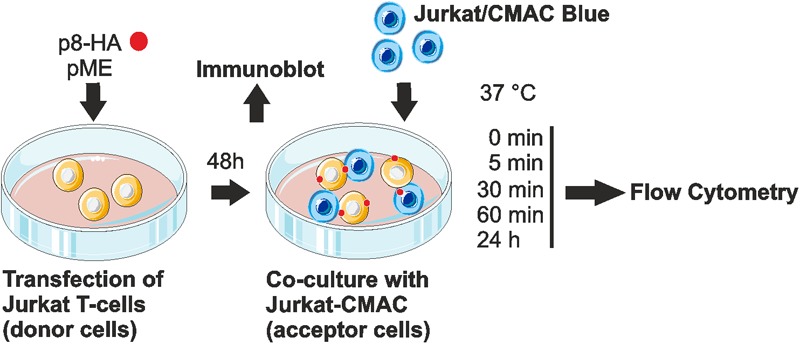
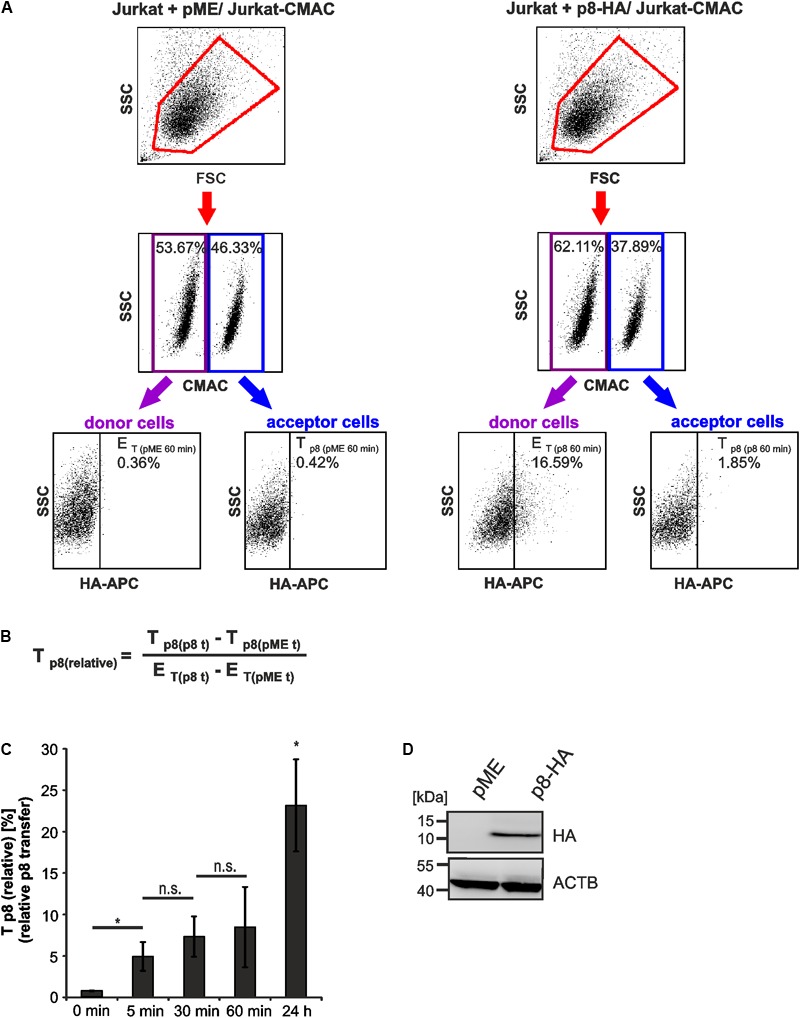
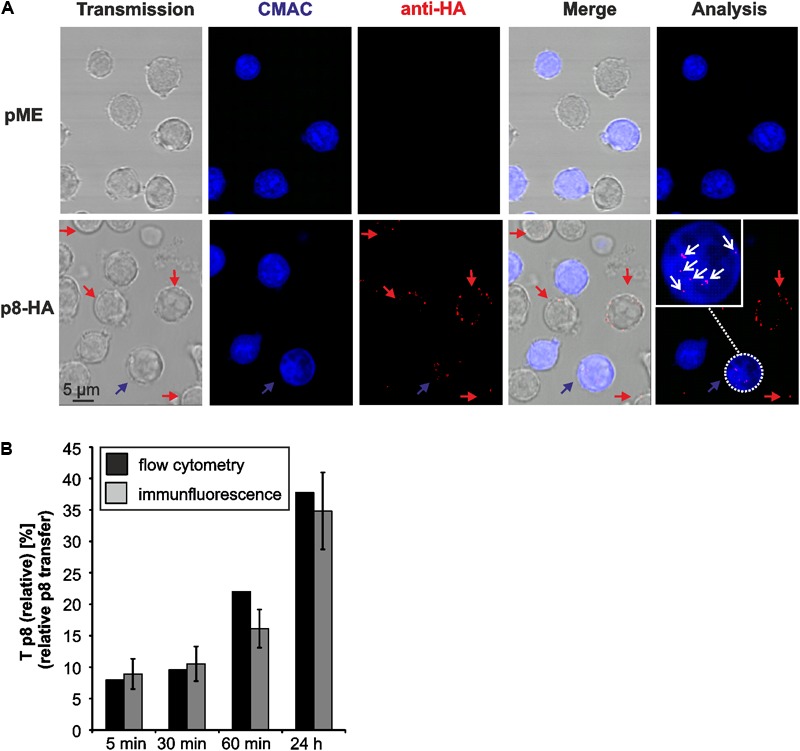
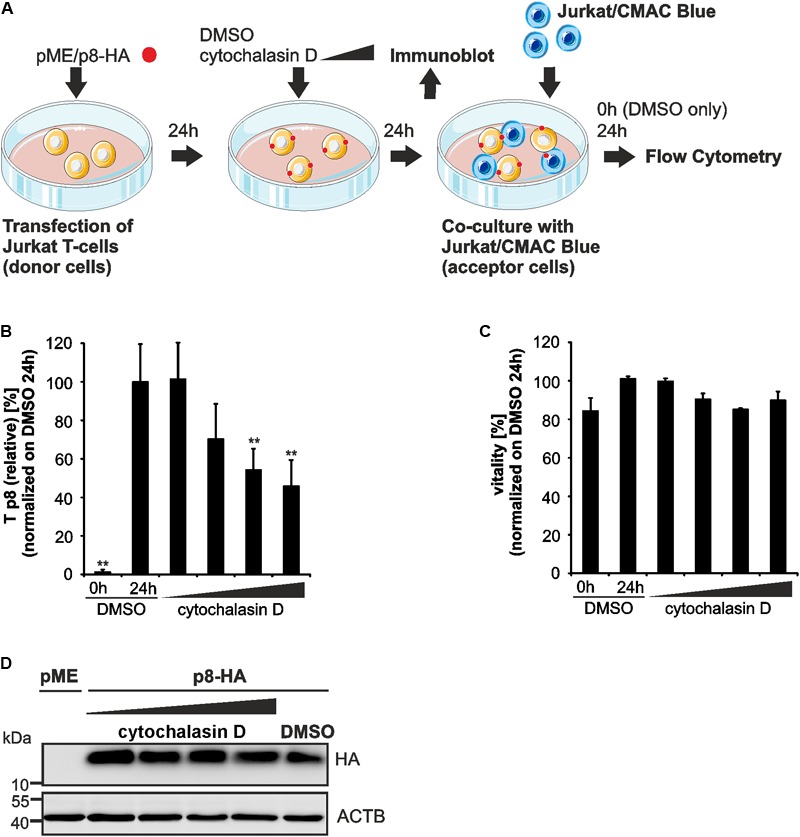
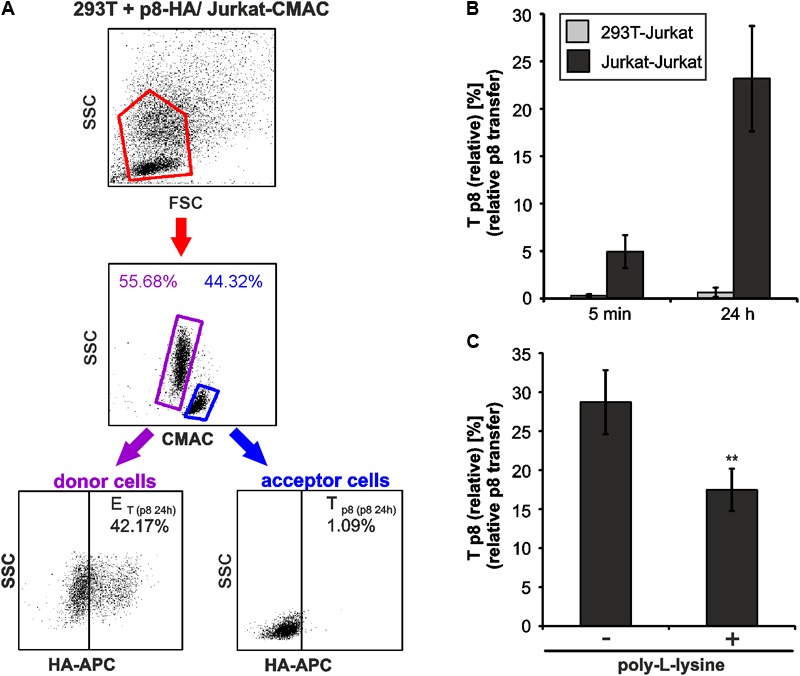
The Human T-cell leukemia virus type 1 (HTLV-1)-encoded accessory protein p8 is cleaved from the precursor protein p12 encoded by the HTLV-1 open reading frame I. Both p12 and p8 are thought to contribute to efficient viral persistence. Mechanistically, p8 induces T-cell conjugates and cellular conduits. The latter are considered to facilitate transfer of p8 to target cells and virus transmission. Transfer of p8 between p8-expressing T-cells and recipient cells has been analyzed by immunofluorescence and live imaging. However, automatic quantitation of p8-transfer between cells has not been studied yet. Here we developed a novel method allowing time saving quantitation of p8 transfer between cells by flow cytometry. After establishing a protocol for the detection of intracellular p8 by flow cytometry and validation of p8 protein expression by western blot and immunofluorescence, we set up a co-culture assay between p8-expressing donor Jurkat T-cells and recipient Jurkat T-cells that had been prestained with a well-retained live cell dye. Upon quantitating the amount of p8 positive recipient cells with regard to the percentage of p8 expressing donor cells, time course experiments confirmed that p8 is rapidly transferred between Jurkat T-cells. We found that p8 enters approximately 5% of recipient T-cells immediately upon co-culture for 5 min. Prolonged co-culture for up to 24 h revealed an increase of relative p8 transfer to approximately 23% of the recipient cells. Immunofluorescence analysis of co-culture experiments and manual quantitation of p8 expression in fluorescence images confirmed the validity of the flow cytometry based assay. Application of the new assay revealed that manipulation of actin polymerization significantly decreased p8 transfer between Jurkat T-cells suggesting an important role of actin dynamics contributing to p8 transfer. Further, transfer of p8 to co-cultured T-cells varies between different donor cell types since p8 transfer could hardly been detected in co-cultures of 293T donor cells with Jurkat acceptor cells. In summary, our novel assay allows automatic and rapid quantitation of p8 transfer to target cells and might thus contribute to a better understanding of cellular processes and dynamics regulating p8 transfer and HTLV-1 transmission.

Keywords: HTLV-1; flow cytometry; p8; protein transport; virus transmission.


Figures

FIGURE 1
FIGURE 1
Detection of p8 by flow cytometry compared to immunofluorescence. (A,B) 293T cells were transfected with p8-HA expression plasmids or the control plasmid pME for 48 h. (A) Flow cytometry after fixation and permeabilization of cells using HA-specific, APC-labeled antibodies. Dot plots display HA-APC-specific fluorescence plotted against the side scatter (SSC). (B) Immunoblot of p8-HA and the housekeeping gene glyceraldehyde-3-phosphate dehydrogenase (GAPDH). (C) Jurkat T-cells were transfected with p8-HA expression plasmids or the control plasmid pME for 48 h. Cells were split and stained either without permeablization buffer (black bar), or upon permeabilization with 0.5% saponin (red bar) or a commercially available intracellular staining kit (blue bar). The mean percentage of p8-HA expressing cells of three experiments ± standard deviation as detected by flow cytometry is shown. (D) Jurkat T-cells were transfected with expression plasmids p8-HA or pME for 48 h and spotted on glass slides. Cells were stained either with or without permeabilization with HA-specific antibodies and the respective secondary antibodies. Analysis by confocal microscopy shows p8-HA (red dots) and the nuclei (DAPI). Blow up: example of a p8-HA-expressing cell.
FIGURE 2
FIGURE 2
Experimental setup of the co-culture assay. Jurkat T-cells were transfected with p8-HA expression plasmids or the control plasmid pME for 48 h. Transfected p8-donor or control (pME) cells were either subjected to immunoblot analysis or co-cultured with equal amounts of Jurkat acceptor cells (1106) that had been prestained with Cell Tracker Blue CMAC Dye (Jurkat-CMAC). At different time points post co-culture at 37°C (0, 5, 30, 60 min, 24 h), cells were fixed in 2% paraformaldehyde (PFA), permeabilized, stained and analyzed by flow cytometry.
FIGURE 3
FIGURE 3
Detection of rapid p8 transfer between Jurkat T-cells by flow cytometry. Jurkat donor T-cells were transfected with p8-HA or the control plasmid pME and co-cultured with prestained acceptor T-cells Jurkat-CMAC according to the experimental setup displayed in Figure 2. (A) Flow cytometry. At 48 h post transfection, equal amounts of donor and acceptor cells (1106 cells each) were either directly fixed in 2% PFA and mixed (time point: 0 min), or they were co-cultured at 37°C for 5, 30, 60 min, or 24 h before fixation. After intracellular staining using HA-specific, APC-labeled antibodies or the respective isotype-matched control antibodies, flow cytometry was performed. Representative dot plots at 60 min post co-culture are shown. First line: Dot plots display the forward scatter (FSC) plotted against the side scatter (SSC) and living cells are gated (red gate). Second line: CMAC-specific fluorescence is plotted against the SSC, which allows discrimination between CMAC-negative donor (purple gate) and CMAC-positive acceptor (blue gate) cells. Third line: HA-specific fluorescence is plotted against the SSC and numbers represent the efficiency of transfection (ET) within the CMAC-negative donor cells (displayed on the left) or the transfer of p8 (Tp8) within the CMAC-positive acceptor cells (displayed on the right). (B) Equation to calculate the relative transfer of p8 [Tp8(relative)] between cells. Tp8 shows the transfer of p8, which corresponds to the percentage of p8-HA positive cells within CMAC-positive acceptor cells (Tp8(p8t)) at a given time point t and which was normalized on background fluorescence of the respective control cells transfected with pME (Tp8(pMEt)). ET represents the efficiency of transfection at a given time point t and corresponds to the percentage of p8-HA positive cells within CMAC-negative donor cells (ET(p8t)), which is corrected by background fluorescence of the respective control cells transfected with pME (ET(pMEt)). (C) Time course analysis of Tp8(relative) as measured by flow cytometry. The means of 3–4 independent experiments ±SE are shown and were compared as indicated using a paired t-test. Indicates p < 0.05; at 24 h, comparison between 24 h and all other times of measurement; n.s., not significant. (D) Representative immunoblot of p8-HA expression in Jurkat T-cells at 48 h post transfection. ACTB (β-Actin) served as housekeeping gene.
FIGURE 4
FIGURE 4
Detection of p8 transfer between Jurkat T-cells by immunofluorescence. (A) Jurkat T-cells were transfected with expression plasmids p8-HA or pME for 48 h and co-cultivated with equal amounts of acceptor Jurkat T-cells prestained with Cell Tracker Blue CMAC (Jurkat-CMAC) on poly-L-lysine coated glass slides for 24 h at 37°C. Thereafter, cells were permeabilized and stained with HA-specific antibodies and the respective secondary antibodies. Slides were covered with ProLong Gold antifade reagent and analyzed by confocal microscopy. A cutout of an optical field shows cells expressing p8-HA (red) within the donor Jurkat T-cells (not stained) and the acceptor Jurkat T-cells (blue). The numbers of p8-positive cells (red) within the acceptor Jurkat T-cells (blue) were counted (white circles). Red arrows: p8-positive donor cells; blue arrows: p8-positive acceptor cell; blow up: example of a p8-expressing acceptor cell; white arrows: p8-HA. (B) Comparison of p8 transfer between flow cytometry (black bars) and immunofluorescence (gray bars). At 48 h post transfection with p8-HA, equal amounts of p8-donor Jurkat T- cells and Jurkat-CMAC acceptor cells (1106 cells each) were co-cultured at 37°C for 5, 30, 60 min or 24 h before fixation. One representative time course experiment of relative p8 transfer [Tp8(relative)] as measured by flow cytometry (as shown for n = 4 in Figure 3C) is compared to the manual quantitation of relative p8 transfer within the same sample by immunofluorescence. Tp8(relative) as measured by immunofluorescence was calculated by normalizing the mean percentage of p8-HA positive cells within CMAC-positive acceptor cells on the mean percentage of p8-HA positive cells within CMAC-negative donor cells in 20 optical fields. SE, standard error.
FIGURE 5
FIGURE 5
Impairment of p8 transfer between T-cells after inhibition of actin polymerization. (A) Experimental setup. At 24 h post transfection of Jurkat T-cells with p8-HA or pME (control) expression plasmids (100 μg each), cells were cultured with increasing concentrations of an inhibitor of actin polymerization, cytochalasin D (0.5, 1, 2.5, 5 μM), or the solvent control dimethylsulfoxide (DMSO) for 24 h. Cells were either subjected to immunoblot analysis or co-cultured in fresh medium (without chemicals) with equal amounts of prestained Jurkat acceptor cells (1106 cells, labeled with Cell Tracker Blue CMAC Dye) for 24 h at 37°C and analyzed by flow cytometry. DMSO-treated donor cells were also taken at 0 h post co-culture and served as negative control for p8 transfer. (B) The relative transfer of p8 [Tp8(relative)] was calculated as explained in Figure 3. Values display the means of at least four independent experiments (±SE) and were normalized on and compared to those of cells treated with DMSO and co-cultured for 24 h using an unpaired t-test. ∗∗Indicates p < 0.01. (C) Viability of Jurkat T-cells upon pretreatment with increasing amounts of cytochalasin D (0.5, 1, 2.5, 5 μM) or the solvent control DMSO for 24 h and co-culture for 0 h (DMSO) or 24 h (DMSO and all other samples) determined by forward-side scatter (FSC/SSC) analysis in flow cytometry. DMSO-treated cells (24 h co-culture) were set as 100%. The means of four independent experiments ±SE were compared to DMSO-treated cells using an unpaired t-test. (D) Representative immunoblot of p8-HA expression in Jurkat T-cells treated with the indicated inhibitors. ACTB served as housekeeping gene.
FIGURE 6
FIGURE 6
Cell type-dependence of an efficient p8 transfer. (A,B) 293T were transfected with p8-HA expression plasmids or the control plasmid pME for 48h. Transfected p8-donor or control (pME) cells were co-cultured with equal amounts of Jurkat acceptor cells (3106) that had been prestained with Cell Tracker Blue CMAC Dye. At 5 min or at 24 h post co-culture at 37°C, cells were fixed in 2% PFA, permeabilized, stained and analyzed by flow cytometry. (A) Representative dot plots of 293T cells transfected with p8-HA expression plasmids after co-culture with Jurkat-CMAC acceptor cells for 24 h are shown. First line: Dot plots display the forward scatter (FSC) plotted against the side scatter (SSC) and living cells are gated (red gate). Second line: CMAC-specific fluorescence is plotted against the SSC, which allows discrimination between CMAC-negative 293T donor (purple gate) and CMAC-positive Jurkat acceptor (blue gate) cells. Third line: HA-specific fluorescence is plotted against the SSC and numbers represent the efficiency of transfection (ET) within the CMAC-negative 293T donor cells (displayed on the left) or the transfer of p8 (Tp8) within the CMAC-positive Jurkat acceptor cells (displayed on the right). (B) Time course analysis of Tp8(relative) as measured by flow cytometry in co-cultures of 293T and Jurkat T-cells. The means of 4 independent experiments ±SE are shown and were compared as indicated using a t-test. For comparison, Tp8(relative) between co-cultured Jurkat T-cells as shown in Figure 3C is displayed. (C) Jurkat donor T-cells were transfected with p8-HA or the control plasmid pME. At 48 h post transfection, 1106 donor cells were either fixed on poly-L-lysine coated culture plates for 1 h or they were left untreated. Thereafter, Jurkat donor T-cells were co-cultured with equal amounts of prestained acceptor T-cells Jurkat-CMAC at 37°C for 24 h and Tp8(relative) was analyzed by flow cytometry. The means of 3 independent experiments ±SE are shown and were compared as indicated using an unpaired t-test. ∗∗Indicates p < 0.01.

Similar articles

Cited by

References

    1. Alais S., Mahieux R., Dutartre H. (2015). Viral source-independent high susceptibility of dendritic cells to human T-cell leukemia virus type 1 infection compared to that of T lymphocytes. J. Virol. 89 10580–10590. 10.1128/JVI.01799-15 - DOI - PMC - PubMed
    1. Carpentier A., Barez P. Y., Hamaidia M., Gazon H., de B. A., Perike S., et al. (2015). Modes of human T cell leukemia virus type 1 transmission, replication and persistence. Viruses 7 3603–3624. 10.3390/v7072793 - DOI - PMC - PubMed
    1. Chevalier S. A., Turpin J., Cachat A., Afonso P. V., Gessain A., Brady J. N., et al. (2014). Gem-induced cytoskeleton remodeling increases cellular migration of HTLV-1-infected cells, formation of infected-to-target T-cell conjugates and viral transmission. PLoS Pathog. 10:e1003917. 10.1371/journal.ppat.1003917 - DOI - PMC - PubMed
    1. Czyz J., Irmer U., Schulz G., Mindermann A., Hulser D. F. (2000). Gap-junctional coupling measured by flow cytometry. Exp. Cell Res. 255 40–46. 10.1006/excr.1999.4760 - DOI - PubMed
    1. de Castro-Amarante M. F., Pise-Masison C. A., McKinnon K., Washington P. R., Galli V., Omsland M., et al. (2015). HTLV-1 infection of the three monocyte subsets contributes to viral burden in humans. J. Virol. 90 2195–2207. 10.1128/JVI.02735-15 - DOI - PMC - PubMed