. 2018 Mar 5:9:210.
doi: 10.3389/fpls.2018.00210. eCollection 2018.

Coding-Sequence Identification and Transcriptional Profiling of Nine AMTs and Four NRTs From Tobacco Revealed Their Differential Regulation by Developmental Stages, Nitrogen Nutrition, and Photoperiod

Affiliations

Coding-Sequence Identification and Transcriptional Profiling of Nine AMTs and Four NRTs From Tobacco Revealed Their Differential Regulation by Developmental Stages, Nitrogen Nutrition, and Photoperiod

Lai-Hua Liu et al. Front Plant Sci. .

Abstract

Although many members encoding different ammonium- and nitrate-transporters (AMTs, NRTs) were identified and functionally characterized from several plant species, little is known about molecular components for [Formula: see text]- and [Formula: see text] acquisition/transport in tobacco, which is often used as a plant model for biological studies besides its agricultural and industrial interest. We reported here the first molecular identification in tobacco (Nicotiana tabacum) of nine AMTs and four NRTs, which are respectively divided into four (AMT1/2/3/4) and two (NRT1/2) clusters and whose functionalities were preliminarily evidenced by heterologous functional-complementation in yeast or Arabidopsis. Tissue-specific transcriptional profiling by qPCR revealed that NtAMT1.1/NRT1.1 mRNA occurred widely in leaves, flower organs and roots; only NtAMT1.1/1.3/2.1NRT1.2/2.2 were strongly transcribed in the aged leaves, implying their dominant roles in N-remobilization from source/senescent tissues. N-dependent expression analysis showed a marked upregulation of NtAMT1.1 in the roots by N-starvation and resupply with N including [Formula: see text], suggesting a predominant action of NtAMT1.1 in [Formula: see text] uptake/transport whenever required. The obvious leaf-expression of other NtAMTs e.g., AMT1.2 responsive to N indicates a major place, where they may play transport roles associated with plant N-status and ([Formula: see text]-)N movement within aerial-parts. The preferentially root-specific transcription of NtNRT1.1/1.2/2.1 responsive to N argues their importance for root [Formula: see text] uptake and even sensing in root systems. Moreover, of all NtAMTs/NRTs, only NtAMT1.1/NRT1.1/1.2 showed their root-expression alteration in a typical diurnal-oscillation pattern, reflecting likely their significant roles in root N-acquisition regulated by internal N-demand influenced by diurnal-dependent assimilation and translocation of carbohydrates from shoots. This suggestion could be supported at least in part by sucrose- and MSX-affected transcriptional-regulation of NtNRT1.1/1.2. Thus, present data provide valuable molecular bases for the existence of AMTs/NRTs in tobacco, promoting a deeper understanding of their biological functions.

Keywords: AMT and NRT; ammonium; gene expression regulation; heterologous complementation; nitrate; nitrogen and carbon balance; tobacco.


Figures
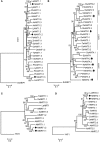
Figure 1
Figure 1
Phylogenetic tree of putative tobacco AMTs (A,B) and NRTs (C,D) with their representative counterparts from other plant species. The trees of AMT1 (A) and AMT2, 3, 4 (B) subclades were rooted using a Saccharomyces cerevisiae ScMEP1 sequence as an outgroup. Likewise, Hansenula polymorpha YNT1 protein was picked as an outgroup for NRT1 (C) and NRT2 (D) subcluster. Phylogenetic analysis was performed using the Neighbor-Joining method from MEGA6. Bootstrap values are from 1,000 replications. Evolutionary distances were estimated in a unit of the number of amino acid substitutions per site, with a scale bar equivalent to 0.1 or 0.2 substitutions per site. The numbers at the nodes are bootstrap values. Sequences and accession numbers of AMTs and NRTs were listed in Tables S2, S4. Sc, Saccharomyces cerevisiae; At, Arabidopsis thaliana; Lj, Lotus japonicas; Le, Lycopersicon esculentum; Os, Oryza sativa; Ptr, Populus trichocarpa; Sb, Sorghum bicolor; Ta, Triticum aestivum; Hv, Hordeum vulgare; YNT1 from Hansenula polymorpha. Nt, Nicotiana tabacum L. (cv K326). NtAMTs and NtNRTs are marked with a black rhombus.
Figure 2
Figure 2
Measurement of the gene expression of AMTs and NRTs in different aged leaves and flower-tissues. Tobacco (K326) was grown in pot-soil for 3 months until flowering (see section Materials and Methods). Relative mRNA accumulation of AMTs and NRTs was assayed by using qPCR (see section Materials and Methods), which was performed with total RNA isolated from petals, calyxes, pedicels, ovaries, young leaves (the 3th leaf counted down from the top first-full-expended leaf), mature leaves (the 10th leaf) and old leaf (the 18th leaf), respectively. Gene-specific primers for a given AMT or NRT were used throughout this study (see Table S3). Before performing qPCR, the correctness of resulting amplicons of target genes was confirmed by DNA sequencing (note: this test was done throughout expression studies). Relative expression levels of AMTs and NRTs relative to that of tobacco α-tubulin (set to 1; Schmidt and Delaney, 2010) were calculated. Means of 3–4 biological replicates ± SD (n = 3–4) were plotted, and different letters above the bars indicate statistically significant differences (P < 0.05 by one-way ANOVA and a multiple comparison test). A second housekeeping gene L25 was also used as an internal control to confirm the expression pattern (Schmidt and Delaney, 2010) (Figures S2A,B). The relative expression of NtAMTs and NtNRTs in mature leaf (A), young leaf (B), old leaf (C), petals (D), calyxes (E), pedicels (F) and ovaries (G).
Figure 3
Figure 3
N-dependent expression of AMTs (A) and NRTs (B) in roots and leaves of tobacco K326. Plant growth and N-treatment are described in section “Materials and Methods”. Total RNA was extracted from roots or leaves (1 d after fully-opened), and relative mRNA abundance of NtAMTs and NtNRTs was quantified by qPCR (see section Materials and Methods). Expression levels of AMTs and NRTs relative to that of α-tubulin (set to 1) were calculated. Data are means of 3–4 biological repeats ± SD (n = 3–4); different letters above the bars indicate statistically significant differences (P < 0.05 by one-way ANOVA and a multiple comparison test). +N, growth with normal N treatment; -N, N-starvation; 1d-N and 3d-N, N-starvation for 1 d or 3 d; N-resupply with NH4+ (for 1, 4, 12 h), NO3- (1, 4, 12 h), urea (4 h), and Gln (4 h) after 3d-N. L25 was also applied as a reference to confirm the expression pattern (Figures S2C,D). Purple or blue bars indicate respectively root and leaf.
Figure 4
Figure 4
Diurnal-dependent expression of AMTs (A) and NRTs (B) in roots and leaves of tobacco k326. Plants were hydroponically cultured in a growth chamber with a 15 h light/9 h dark circle (08:00–23:00/23:00–8:00) (see section Materials and Methods). Plant samples were harvested at 2:00, 6:00, 10:00, 14:00, and 20:00. Relative mRNA accumulation of NtAMTs and NtNRTs was quantified by qPCR, which was conducted with total RNA from roots and leaves (1 d after fully-opened) of plants grown on normal nutrition solution for 3-week (see section Materials and Methods). Expression levels of NtAMTs and NtNRTs are relative to that of α-tubulin gene (set to 1). Mean values of 3–4 biological samples ± SD (n = 3–4) were shown. L25 was used as a second reference gene to affirm the expression pattern observed from that using tubulin as an internal control (Figures S2E,F). Purple or blue lines indicate respectively root and leaf. The relative expression of those NtAMTs with a low level and less diurnal-variation pattern is shown in Figure S4.
Figure 5
Figure 5
Heat map of transcriptional regulations of AMTs and NRTs in tobacco K326 by external sucrose and MSX. Plants were hydroponically grown (for 15 d) in normal nutrient solution and treated with 1% sucrose (A) or 1 mM MSX (B) for a time period of 0, 2, 4, or 6 h (see section Materials and Methods). Total RNA was extracted from roots and leaves (1 d after fully-opened); relative mRNA abundance of NtAMTs and NtNRTs was quantified by using qPCR, and the expression level of AMTs and NRTs relative to that of L25 (set to 1) in each sample was calculated (see section Materials and Methods). A relative gene-expression abundance (derived from a difference of transcript levels between with and without MSX- or sucrose-treatment at each time point, except for time 0) was presented in a false color scale, where green or red color indicates respectively a lowest or highest expression with an absolute mean value at 0 or 10.
Figure 6
Figure 6
Growth complementation of a yeast or Arabidopsis mutant by heterologous expression of NtAMTs and NtNRTs. (A) Functional complementation of yeast mutant 31019b by the transformation of individual NtAMTs. The yeast strain 23346c (Δura3) and 31019b (Δmep1-3, Δura3; defective in NH4+ uptake) transformed with a yeast expression-vector pHXT426 alone or harboring a putative ORF of NtAMT1.1, 1.2, 1.3, 2.1, 3.1, 4.1, and 4.3 were grown first on SD-medium agar plate containing 20 mM NH4+ as N source. A single colony was picked, suspended in 5 μl water and streaked onto the SD plate containing 2 mM NH4+ as sole N form. 31019b did not grow on <5 mM NH4+. Pictures were taken 5–6 days after yeast growth on NH4+ medium. P and N, positive and negative control (i.e., 23346c or 31019b harboring just pHXT426). (B–E) Expression of NtNRT1.1/1.2 in an Arabidopsis mutant improved plant growth on nitrate. The putative ORF of NtNRT1.1 or NtNRT1.2 cloned after CaMV 35S-promoter was introduced into the Arabidopsis atnrt1.1-1 line defected in NRT1.1 gene (Hachiya et al., 2011), and two independent transgenic lines of NtNRT1.1- or NtNRT1.2-transformed atnrt1.1 were used in the experiment. (B) Detection of gene expression in transgenic and non-transgenic (atnrt1.1 and WT) plants. Semi-quantitative RT-PCR was conducted on total RNA from roots sampled from the experiment (C). Primers for the amplification of NtNRT1.1- or NtNRT1.2- ORF were used (Table S3), and an Arabidopsis housekeeping gene ACT2 served as a reference (Liu et al., 2003). The correctness of resulting amplicons was confirmed via DNA sequencing. (C) Growth phenotype of WT, atnrt1.1-1, atnrt1.1-1+NtNRT1.1 (line 2 and 3) and atnrt1.1-1 +NtNRT1.2 (line 2 and 5). Plants were grown on 1/2 strength MS (N-free) agar-plate supplied with 0.1 or 5 mM KNO3 as only N source. Representative pictures were taken 10 days after plant growth on NO3-. Shoot (D) and root (E) biomass of WT, atnrt1.1-1 and the transgenic lines. Data represent mean ± SD (n = 6 biological repeats, six plants in each), and different letters above the bars indicate statistically significant differences (P < 0.05 by one-way ANOVA and a multiple comparison test).

Similar articles

Cited by

References

    1. Alvarez J. M., Vidal E. A., Gutierrez R. A. (2012). Integration of local and systemic signaling pathways for plant N responses. Curr. Opin. Plant Biol. 15, 185–191. 10.1016/j.pbi.2012.03.009 - DOI - PubMed
    1. Buchner P., Hawkesford M. J. (2014). Complex phylogeny and gene expression patterns of members of the nitrate transporter 1/peptide transporter family (NPF) in wheat. J. Exp. Bot. 65, 5697–5710. 10.1093/jxb/eru231 - DOI - PMC - PubMed
    1. Burge C., Karlin S. (1997). Prediction of complete gene structures in human genomic DNA. J. Mol. Biol. 268, 78–94. 10.1006/jmbi.1997.0951 - DOI - PubMed
    1. Chen X., Yao Q., Gao X., Jiang C., Harberd N. P., Fu X. (2016). Shoot-to-root mobile transcription factor HY5 coordinates plant carbon and nittrogen acquisition. Curr. Biol. 26, 640–646. 10.1016/j.cub.2015.12.066 - DOI - PubMed
    1. Chen Y.-F., Wang Y., Wu W.-H. (2008). Membrane transporters for nitrogen, phosphate and potassium uptake in plants. J. Integr. Plant Biol. 50, 835–848. 10.1111/j.1744-7909.2008.00707.x - DOI - PubMed