

Application of Least-Squares Support Vector Machines for Quantitative Evaluation of Known Contaminant in Water Distribution System Using Online Water Quality Parameters
- PMID: 29565295
- PMCID: PMC5948656
- DOI: 10.3390/s18040938
Application of Least-Squares Support Vector Machines for Quantitative Evaluation of Known Contaminant in Water Distribution System Using Online Water Quality Parameters
Abstract
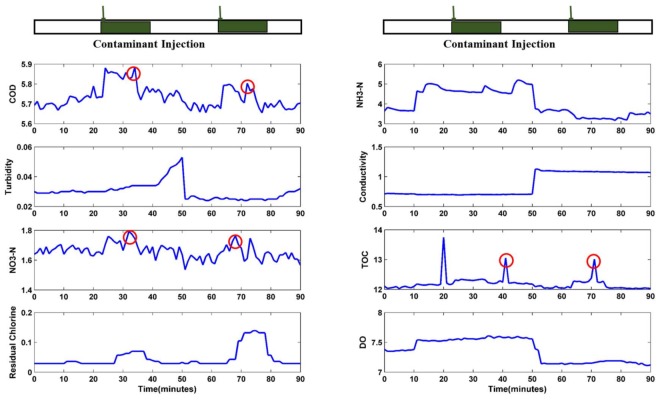
In water-quality, early warning systems and qualitative detection of contaminants are always challenging. There are a number of parameters that need to be measured which are not entirely linearly related to pollutant concentrations. Besides the complex correlations between variable water parameters that need to be analyzed also impairs the accuracy of quantitative detection. In aspects of these problems, the application of least-squares support vector machines (LS-SVM) is used to evaluate the water contamination and various conventional water quality sensors quantitatively. The various contaminations may cause different correlative responses of sensors, and also the degree of response is related to the concentration of the injected contaminant. Therefore to enhance the reliability and accuracy of water contamination detection a new method is proposed. In this method, a new relative response parameter is introduced to calculate the differences between water quality parameters and their baselines. A variety of regression models has been examined, as result of its high performance, the regression model based on genetic algorithm (GA) is combined with LS-SVM. In this paper, the practical application of the proposed method is considered, controlled experiments are designed, and data is collected from the experimental setup. The measured data is applied to analyze the water contamination concentration. The evaluation of results validated that the LS-SVM model can adapt to the local nonlinear variations between water quality parameters and contamination concentration with the excellent generalization ability and accuracy. The validity of the proposed approach in concentration evaluation for potassium ferricyanide is proven to be more than 0.5 mg/L in water distribution systems.
Keywords: LS-SVM; conventional water-quality sensors; quantitative evaluation; water quality early warning.
Conflict of interest statement
The authors declare no conflict of interest.
Figures


Similar articles
-
Online Classification of Contaminants Based on Multi-Classification Support Vector Machine Using Conventional Water Quality Sensors.Sensors (Basel). 2017 Mar 13;17(3):581. doi: 10.3390/s17030581. Sensors (Basel). 2017. PMID: 28335400 Free PMC article.
-
Multivariate calibration with least-squares support vector machines.Anal Chem. 2004 Jun 1;76(11):3099-105. doi: 10.1021/ac035522m. Anal Chem. 2004. PMID: 15167788
-
Chemometrics-assisted simultaneous voltammetric determination of ascorbic acid, uric acid, dopamine and nitrite: application of non-bilinear voltammetric data for exploiting first-order advantage.Talanta. 2014 Feb;119:553-63. doi: 10.1016/j.talanta.2013.11.028. Epub 2013 Nov 27. Talanta. 2014. PMID: 24401455
-
Inline Measurement of Particle Concentrations in Multicomponent Suspensions using Ultrasonic Sensor and Least Squares Support Vector Machines.Sensors (Basel). 2015 Sep 18;15(9):24109-24. doi: 10.3390/s150924109. Sensors (Basel). 2015. PMID: 26393611 Free PMC article.
-
Contamination event detection using multiple types of conventional water quality sensors in source water.Environ Sci Process Impacts. 2014 Aug;16(8):2028-38. doi: 10.1039/c4em00188e. Environ Sci Process Impacts. 2014. PMID: 24953418
Cited by
-
Identification of water pollution sources and analysis of pollution trigger conditions in Jiuqu River, Luxian County, China.Environ Sci Pollut Res Int. 2024 Mar;31(13):19815-19830. doi: 10.1007/s11356-024-32427-6. Epub 2024 Feb 17. Environ Sci Pollut Res Int. 2024. PMID: 38367117
-
A Machine Learning-based Algorithm for Water Network Contamination Source Localization.Sensors (Basel). 2020 May 3;20(9):2613. doi: 10.3390/s20092613. Sensors (Basel). 2020. PMID: 32375289 Free PMC article.
-
A Virtual Sensing Concept for Nitrogen and Phosphorus Monitoring Using Machine Learning Techniques.Sensors (Basel). 2022 Sep 27;22(19):7338. doi: 10.3390/s22197338. Sensors (Basel). 2022. PMID: 36236438 Free PMC article.
References
-
- Hasan J. Technologies and Techniques for Early Warning Systems to Monitor and Evaluate Drinking Water Quality A State-of-the-Art Review. Environmental Protection Agency; Washington, DC, USA: 2005.
-
- Hart D.B., Mckenna S.A., Murray R., Haxton T. Combining Water Quality and Operational Data for Improved Event Detection. ASCE Library; Tucson, AZ, USA: 2010.
-
- He H. Research on Multi-Sensor Data Fusion for Water Quality Events Detection. Zhejiang University; Zhejiang, China: 2013.
LinkOut - more resources
Full Text Sources
Other Literature Sources
