. 2018 Mar 22;13(3):e0194170.
doi: 10.1371/journal.pone.0194170. eCollection 2018.

Fluid shear stress impacts ovarian cancer cell viability, subcellular organization, and promotes genomic instability

Affiliations

Fluid shear stress impacts ovarian cancer cell viability, subcellular organization, and promotes genomic instability

Alexandra R Hyler et al. PLoS One. .

Abstract

Ovarian cancer cells are exposed to physical stress in the peritoneal cavity during both tumor growth and dissemination. Ascites build-up in metastatic ovarian cancer further increases the exposure to fluid shear stress. Here, we used a murine, in vitro ovarian cancer progression model in parallel with immortalized human cells to investigate how ovarian cancer cells of increasing aggressiveness respond to [Formula: see text] of fluid-induced shear stress. This biophysical stimulus significantly reduced cell viability in all cells exposed, independent of disease stage. Fluid shear stress induced spheroid formation and altered cytoskeleton organization in more tumorigenic cell lines. While benign ovarian cells appeared to survive in higher numbers under the influence of fluid shear stress, they exhibited severe morphological changes and chromosomal instability. These results suggest that exposure of benign cells to low magnitude fluid shear stress can induce phenotypic changes that are associated with transformation and ovarian cancer progression. Moreover, exposure of tumorigenic cells to fluid shear stress enhanced anchorage-independent survival, suggesting a role in promoting invasion and metastasis.


Conflict of interest statement

Competing Interests: The authors have declared that no competing interests exist.

Figures

Fig 1
Fig 1. Experimental design.
Overview of the experimental design used in this study. Cells were seeded and either immediately placed on the rotator (A) or allowed to adhere for 4 h before being placed under FSS conditions (B). Cells were re-seeded at their original density after each 96 hour period of exposure to FSS. Analysis was performed at three different time points corresponding to a total of 96 h, 192 h, or 288h FSS exposure, respectively.
Fig 2
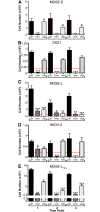
Fig 2. Cell survival.
FSS differentially affects cell viability in ovarian cancer cells of different disease stage. Time-dependent changes in average cell number (x106) ± SEM of MOSE-E (A), OCE1 (B), MOSE-L (C), SKOV-3 (D), and MOSE-LTICv (E) cells subjected to FSS of 0.14dynecm2 for 96 h periods (time points 1-3) are shown. In each graph, the red line indicates the initial seeding number (2x10⁵). Asterisks denote statistical significance (ANOVA, Tukey’s * p< 0.05, ** p< 0.005, and *** p< 0.001) as compared to the corresponding control group at the same time point.
Fig 3
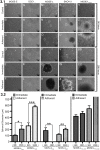
Fig 3. Spheroid formation images and size quantification.
FSS induces spheroid formation in tumorigenic ovarian cancer cells. (3.1) Images of differential spheroid formation, adherence and outgrowth of benign (MOSE-E, OCE1), tumorigenic (MOSE-L, SKOV-3), and highly aggressive (MOSE-LTICv) ovarian cancer cells at 96 h (A-I) and 288 h (time point 3, K-S) in response to FSS. All representative images were taken at the center of the plates. (3.2) the diameter of the formed spheroids were measured and averaged at each time point to monitor growth over time. Significant growth in spheroid diameter was measured in both FSS-exposed MOSE-L cells. In addition, MOSE-LTICv-imm cells formed large spheroids that grew over time. Note: the MOSE-LTICv-adh cells re-attached to the culture dishes with an adherent monolayer outgrowth too large to be measured, but the diameters after 288 h are at least 700μm. Asterisks denote statistical significance (t-test, * p< 0.05, ** p< 0.005, and *** p< 0.001).
Fig 4
Fig 4. Actin cytoskeleton and focal adhesion organization.
Actin cytoskeleton organization and focal adhesion number and length change significantly in response to FSS exposure. (A) Changes in actin (green) organization in adherent MOSE-E, COE1, MOSE-L, SKOV-3, and MOSE-LTICv cells after three, consecutive 96 h exposures to FSS. (B) FSS effects on vinculin-positive focal adhesions. Nuclei are shown in blue. (C) Quantitation of focal adhesion number and size in controls and after FSS exposure. Asterisks denote statistical significance (t-test, * p< 0.05 and *** p< 0.001).
Fig 5
Fig 5. Lobed nuclei images and quantification.
FSS induces the emergence of cells with multi-lobed nuclei. (A) Representative images of normal nuclei (left), a multi-lobed nucleus (middle), and a multi-nucleated cell (right) observed after three consecutive 96 h (288 h total) exposures to FSS. (B) Percentage of cells that exhibit multi-lobed or multi-nucleated nuclei (mean ± SEM). Asterisks denote statistical significance (Fisher’s Exact, * p< 0.05, ** p< 0.005) for comparison to the corresponding control.
Fig 6
Fig 6. Micronuclei images and quantification.
FSS exposure results in an increase in CREST-positive micronuclei. Micronuclei were observed in all cell populations and quantified on multiple slides using CREST (green) and DAPI (red) staining for control and adherent cell populations (after three, consecutive, 96 h exposures to FSS). (A) Representative images of cells with either a CREST-positive (CREST+, containing whole chromosomes, left) or a CREST-negative (CREST-, containing chromosome fragments, right) micronucleus (white arrows). (B) Average percentages of micronuclei ± SEM. Importantly, all stages of the disease exposed to FSS displayed a significant increase in CREST-positive (whole chromosome-containing) micronuclei. Asterisks denote statistical significance (Fisher’s Exact, * p< 0.05, ** p< 0.005, *** p< 0.001) for comparison of adherent cells exposed to FSS to corresponding controls.
Fig 7
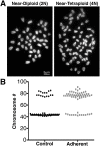
Fig 7. Metaphase images and quantification.
FSS dramatically increases the fraction of MOSE-E cells with near-tetraploid chromosome numbers. (A) Examples of metaphase spreads with near-diploid (left) and near-tetraploid (right) range. (B) Chromosome counts in individual metaphase spreads from the control (black) and FSS-exposed adherent (gray) MOSE-E cells. Upon exposure to FSS, the fraction of near tetraploid cells increased to 76% ± 2.4% compared to 31% ± 5.0% in the control population (χ2, p = 0.013).

References

    1. Heng HH, Stevens JB, Bremer SW, Liu G, Abdallah BY, Ye CJ. Evolutionary mechanisms and diversity in cancer. Adv Cancer Res. 2011;112:217–53. doi: 10.1016/B978-0-12-387688-1.00008-9 - DOI - PubMed
    1. Siegel RL, Miller KD, Jemal A. Cancer statistics, 2017. CA: A Cancer Journal for Clinicians. 2017;67(1):7–30. - PubMed
    1. Howlader N KMMDBKKCLYMRJTZMALDRCHSFEJCKA Noone A M. SEER Cancer Statistics Review, 1975-2014. National Cancer Institute. 2017;.
    1. Avraham-Chakim L, Elad D, Zaretsky U, Kloog Y, Jaffa A, Grisaru D. Fluid-flow induced wall shear stress and epithelial ovarian cancer peritoneal spreading. PLoS One. 2013;8(4):e60965 doi: 10.1371/journal.pone.0060965 - DOI - PMC - PubMed
    1. Tan DS, Agarwal R, Kaye SB. Mechanisms of transcoelomic metastasis in ovarian cancer. Lancet Oncol. 2006;7(11):925–34. doi: 10.1016/S1470-2045(06)70939-1 - DOI - PubMed

Publication types