

Cold argon-oxygen plasma species oxidize and disintegrate capsid protein of feline calicivirus
- PMID: 29566061
- PMCID: PMC5864060
- DOI: 10.1371/journal.pone.0194618
Cold argon-oxygen plasma species oxidize and disintegrate capsid protein of feline calicivirus
Abstract
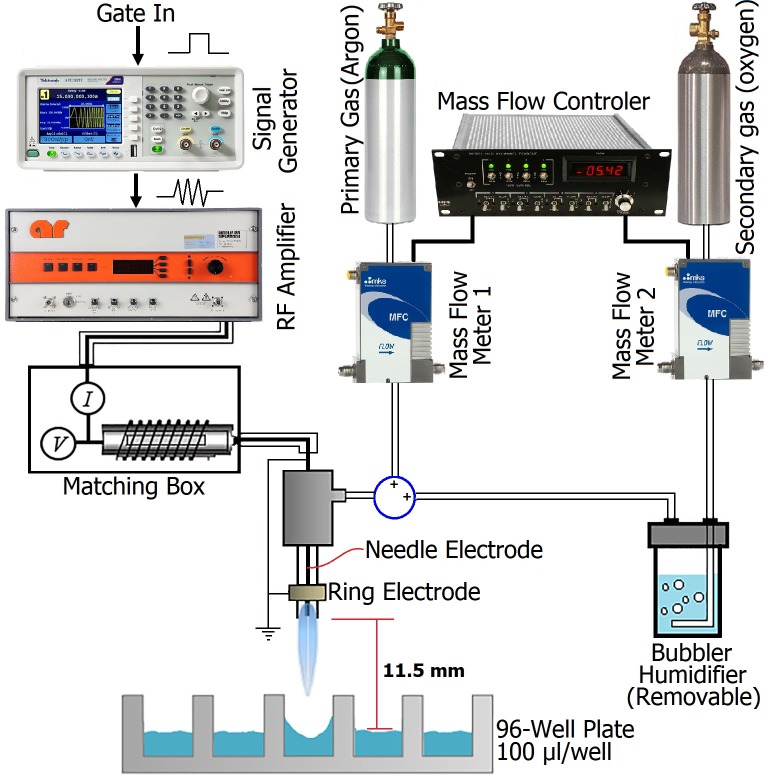
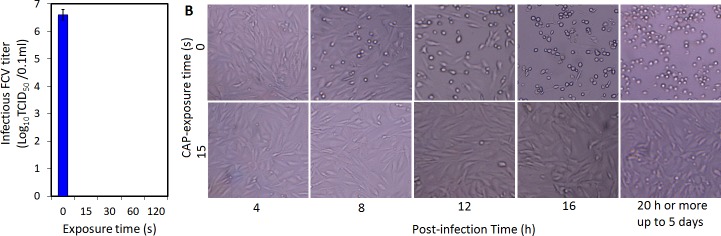
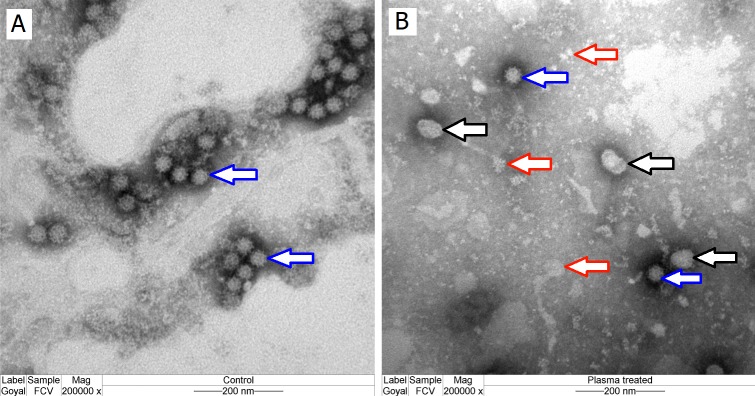
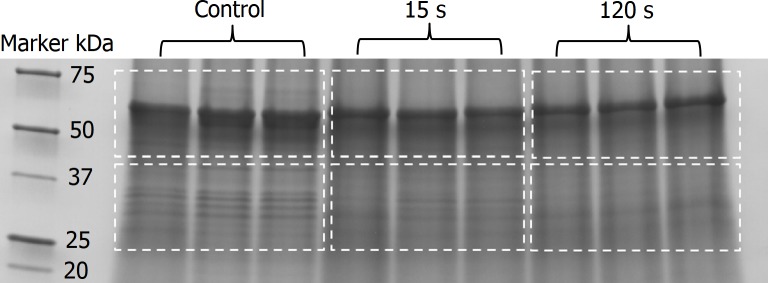
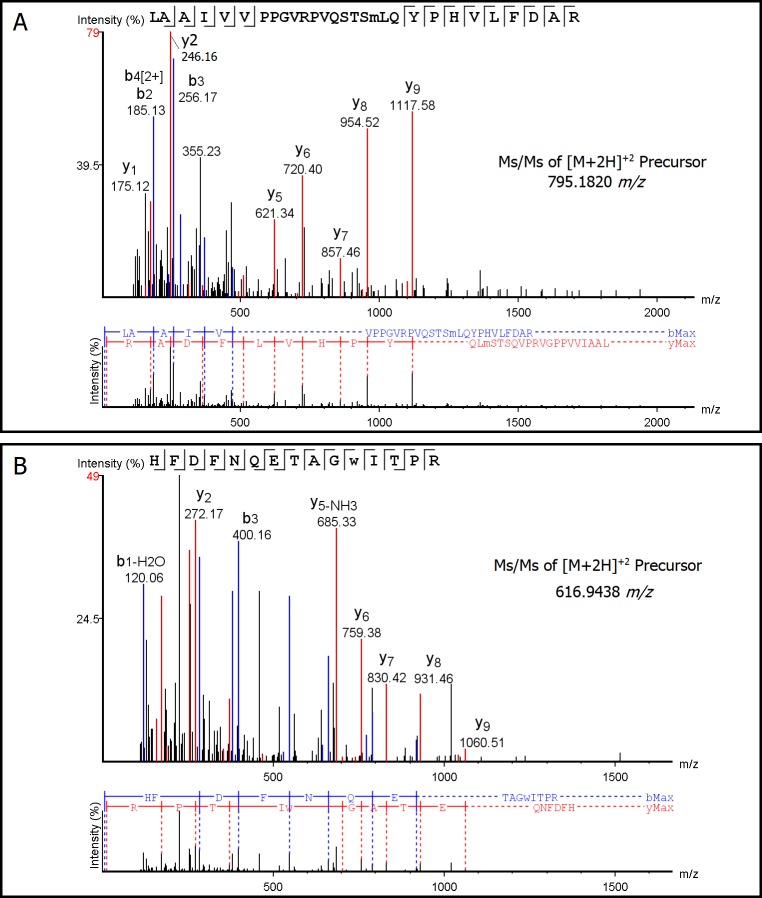
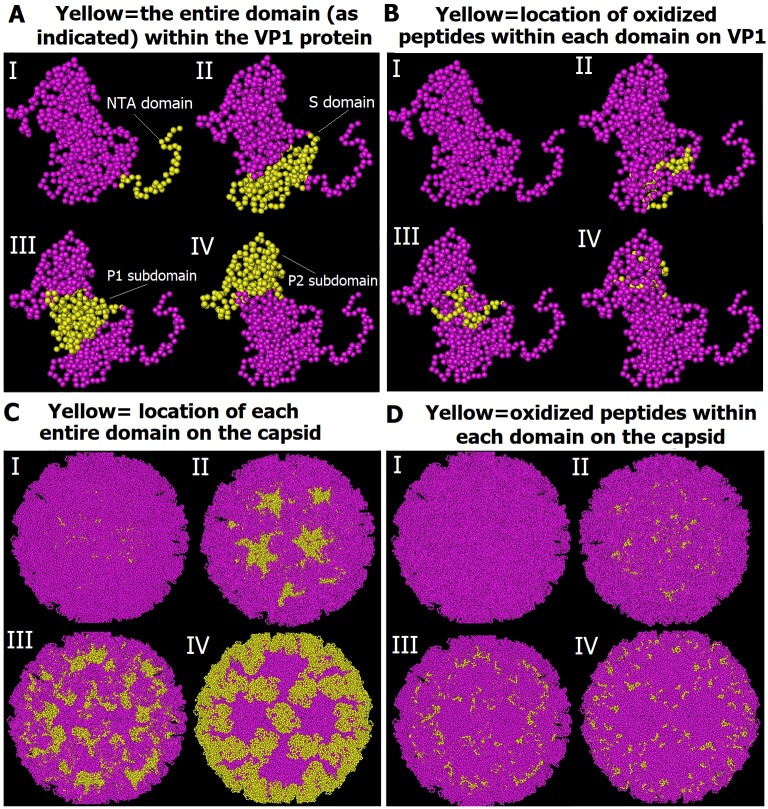
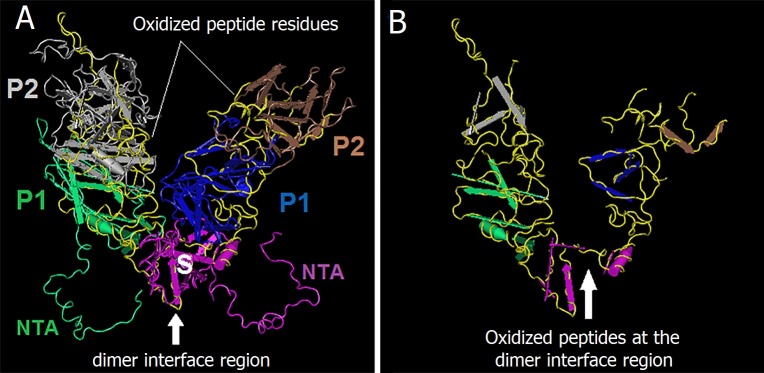
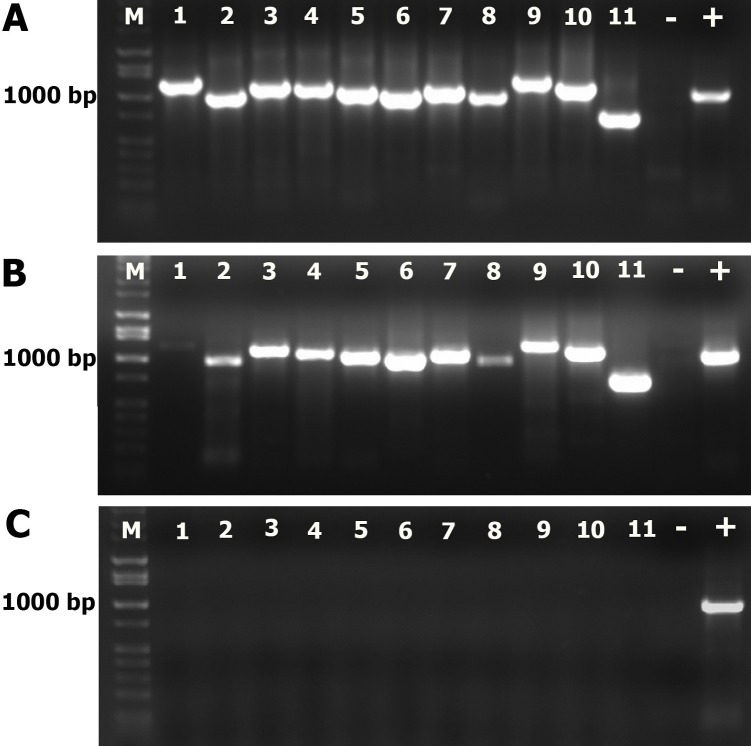
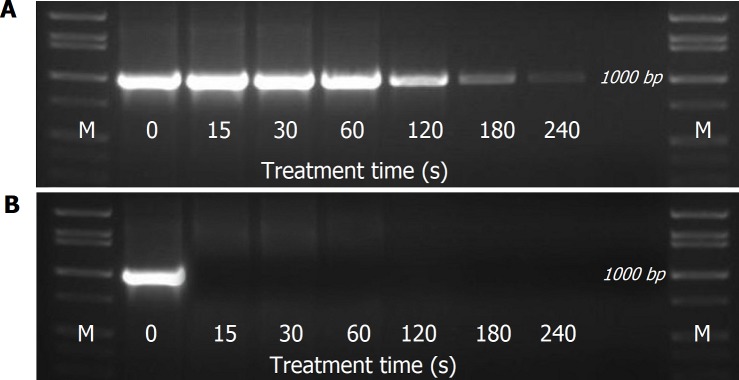
Possible mechanisms that lead to inactivation of feline calicivirus (FCV) by cold atmospheric-pressure plasma (CAP) generated in 99% argon-1% O2 admixture were studied. We evaluated the impact of CAP exposure on the FCV viral capsid protein and RNA employing several cultural, molecular, proteomic and morphologic characteristics techniques. In the case of long exposure (2 min) to CAP, the reactive species of CAP strongly oxidized the major domains of the viral capsid protein (VP1) leading to disintegration of a majority of viral capsids. In the case of short exposure (15 s), some of the virus particles retained their capsid structure undamaged but failed to infect the host cells in vitro. In the latter virus particles, CAP exposure led to the oxidation of specific amino acids located in functional peptide residues in the P2 subdomain of the protrusion (P) domain, the dimeric interface region of VP1 dimers, and the movable hinge region linking the S and P domains. These regions of the capsid are known to play an essential role in the attachment and entry of the virus to the host cell. These observations suggest that the oxidative effect of CAP species inactivates the virus by hindering virus attachment and entry into the host cell. Furthermore, we found that the oxidative impact of plasma species led to oxidation and damage of viral RNA once it becomes unpacked due to capsid destruction. The latter effect most likely plays a secondary role in virus inactivation since the intact FCV genome is infectious even after damage to the capsid.
Conflict of interest statement
Figures
Similar articles
-
Conserved Surface Residues on the Feline Calicivirus Capsid Are Essential for Interaction with Its Receptor Feline Junctional Adhesion Molecule A (fJAM-A).J Virol. 2018 Mar 28;92(8):e00035-18. doi: 10.1128/JVI.00035-18. Print 2018 Apr 15. J Virol. 2018. PMID: 29386293 Free PMC article.
-
The Feline calicivirus capsid protein VP1 is a client of the molecular chaperone Hsp90.J Gen Virol. 2024 Oct;105(10):002030. doi: 10.1099/jgv.0.002030. J Gen Virol. 2024. PMID: 39373166 Free PMC article.
-
Multiple Correspondence Analysis on Amino Acid Properties within the Variable Region of the Capsid Protein Shows Differences between Classical and Virulent Systemic Feline Calicivirus Strains.Viruses. 2019 Nov 23;11(12):1090. doi: 10.3390/v11121090. Viruses. 2019. PMID: 31771183 Free PMC article.
-
[Progress in establishment and application of feline calicivirus reverse genetics operating system].Bing Du Xue Bao. 2015 Jan;31(1):74-9. Bing Du Xue Bao. 2015. PMID: 25997334 Review. Chinese.
-
Feline calicivirus.Vet Res. 2007 Mar-Apr;38(2):319-35. doi: 10.1051/vetres:2006056. Epub 2007 Feb 13. Vet Res. 2007. PMID: 17296159 Review.
Cited by
-
Plasma-activated water: Candidate hand disinfectant for SARS-CoV-2 transmission disruption.Heliyon. 2024 Jul 9;10(15):e34337. doi: 10.1016/j.heliyon.2024.e34337. eCollection 2024 Aug 15. Heliyon. 2024. PMID: 39144986 Free PMC article.
-
Foodborne Viruses and Innovative Non-Thermal Food-Processing Technologies.Foods. 2020 Oct 23;9(11):1520. doi: 10.3390/foods9111520. Foods. 2020. PMID: 33113926 Free PMC article. Review.
-
Cold Argon Athmospheric Plasma for Biomedicine: Biological Effects, Applications and Possibilities.Antioxidants (Basel). 2022 Jun 27;11(7):1262. doi: 10.3390/antiox11071262. Antioxidants (Basel). 2022. PMID: 35883753 Free PMC article. Review.
-
Research Progress on Biological Accumulation, Detection and Inactivation Technologies of Norovirus in Oysters.Foods. 2023 Oct 24;12(21):3891. doi: 10.3390/foods12213891. Foods. 2023. PMID: 37959010 Free PMC article. Review.
-
Inactivation of Pepper Mild Mottle Virus in Water by Cold Atmospheric Plasma.Front Microbiol. 2021 Jan 28;12:618209. doi: 10.3389/fmicb.2021.618209. eCollection 2021. Front Microbiol. 2021. PMID: 33584622 Free PMC article.
References
-
- Misra NN, Tiwari BK, Raghavarao KS, Cullen PJ. Nonthermal plasma inactivation of food-borne pathogens. Food Engineering Reviews. 2011. December 1;3(3–4):159–70.
-
- Alkawareek MY, Algwari QT, Gorman SP, Graham WG, O'connell D, Gilmore BF. Application of atmospheric pressure nonthermal plasma for the in vitro eradication of bacterial biofilms. Pathogens and Disease. 2012. July 1;65(2):381–4. - PubMed
-
- Van Gils CA, Hofmann S, Boekema BK, Brandenburg R, Bruggeman PJ. Mechanisms of bacterial inactivation in the liquid phase induced by a remote RF cold atmospheric pressure plasma jet. Journal of Physics D: Applied Physics. 2013. April 8;46(17):175203.
-
- Baier M, Görgen M, Ehlbeck J, Knorr D, Herppich WB, Schlüter O. Non-thermal atmospheric pressure plasma: screening for gentle process conditions and antibacterial efficiency on perishable fresh produce. Innovative Food Science & Emerging Technologies. 2014. April 30;22:147–57.
-
- Hertwig C, Reineke K, Ehlbeck J, Knorr D, Schlüter O. Decontamination of whole black pepper using different cold atmospheric pressure plasma applications. Food Control. 2015. September 30;55:221–9.
Publication types
MeSH terms
Substances
LinkOut - more resources
Full Text Sources
Other Literature Sources
Molecular Biology Databases
Miscellaneous
