

QuimP: analyzing transmembrane signalling in highly deformable cells
- PMID: 29566132
- PMCID: PMC6061833
- DOI: 10.1093/bioinformatics/bty169
QuimP: analyzing transmembrane signalling in highly deformable cells
Abstract
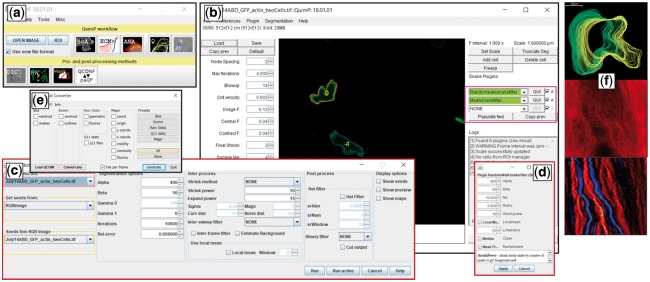
Summary: Transmembrane signalling plays important physiological roles, with G protein-coupled cell surface receptors being particularly important therapeutic targets. Fluorescent proteins are widely used to study signalling, but analyses of image time series can be challenging, in particular when cells change shape. QuimP software semi-automatically tracks spatio-temporal patterns of fluorescence at the cell membrane at high spatial resolution. This makes it a unique tool for studying transmembrane signalling, particularly during cell migration in immune or cancer cells for example.
Availability and implementation: QuimP (http://warwick.ac.uk/quimp) is a set of Java plugins for Fiji/ImageJ (http://fiji.sc) installable through the Fiji Updater (http://warwick.ac.uk/quimp/wiki-pages/installation). It is compatible with Mac, Windows and Unix operating systems, requiring version >1.45 of ImageJ and Java 8. QuimP is released as open source (https://github.com/CellDynamics/QuimP) under an academic licence.
Supplementary information: Supplementary data are available at Bioinformatics online.
Figures
Similar articles
-
RainbowSTORM: an open-source ImageJ plug-in for spectroscopic single-molecule localization microscopy (sSMLM) data analysis and image reconstruction.Bioinformatics. 2020 Dec 8;36(19):4972-4974. doi: 10.1093/bioinformatics/btaa635. Bioinformatics. 2020. PMID: 32663240 Free PMC article.
-
MiCellAnnGELo: annotate microscopy time series of complex cell surfaces with 3D virtual reality.Bioinformatics. 2023 Jan 1;39(1):btad013. doi: 10.1093/bioinformatics/btad013. Bioinformatics. 2023. PMID: 36629475 Free PMC article.
-
Goldilocks: a tool for identifying genomic regions that are 'just right'.Bioinformatics. 2016 Jul 1;32(13):2047-9. doi: 10.1093/bioinformatics/btw116. Epub 2016 Mar 7. Bioinformatics. 2016. PMID: 27153673 Free PMC article.
-
SMLocalizer, a GPU accelerated ImageJ plugin for single molecule localization microscopy.Bioinformatics. 2018 Jan 1;34(1):137-138. doi: 10.1093/bioinformatics/btx553. Bioinformatics. 2018. PMID: 28968783 Free PMC article.
-
PySCeSToolbox: a collection of metabolic pathway analysis tools.Bioinformatics. 2018 Jan 1;34(1):124-125. doi: 10.1093/bioinformatics/btx567. Bioinformatics. 2018. PMID: 28968872
Cited by
-
Coactosin Phosphorylation Controls Entamoeba histolytica Cell Membrane Protrusions and Cell Motility.mBio. 2020 Aug 4;11(4):e00660-20. doi: 10.1128/mBio.00660-20. mBio. 2020. PMID: 32753489 Free PMC article.
-
Relief of talin autoinhibition triggers a force-independent association with vinculin.J Cell Biol. 2020 Jan 6;219(1):e201903134. doi: 10.1083/jcb.201903134. J Cell Biol. 2020. PMID: 31816055 Free PMC article.
-
pERK transition-induced directional mode switching promotes epithelial tumor cell migration.Proc Natl Acad Sci U S A. 2024 Dec 17;121(51):e2318871121. doi: 10.1073/pnas.2318871121. Epub 2024 Dec 13. Proc Natl Acad Sci U S A. 2024. PMID: 39671185 Free PMC article.
-
Quantitative Phase Imaging of Spreading Fibroblasts Identifies the Role of Focal Adhesion Kinase in the Stabilization of the Cell Rear.Biomolecules. 2020 Jul 22;10(8):1089. doi: 10.3390/biom10081089. Biomolecules. 2020. PMID: 32707896 Free PMC article.
-
C9orf72-Derived Proline:Arginine Poly-Dipeptides Modulate Cytoskeleton and Mechanical Stress Response.Front Cell Dev Biol. 2022 Mar 23;10:750829. doi: 10.3389/fcell.2022.750829. eCollection 2022. Front Cell Dev Biol. 2022. PMID: 35399536 Free PMC article.
References
-
- Arganda-Carreras I. et al. (2017) Trainable Weka Segmentation: a machine learning tool for microscopy pixel classification. Bioinformatics, 33, 2424–2426. - PubMed
-
- Dormann D. et al. (2002) Simultaneous quantification of cell motility and protein-membrane-association using active contours. Cell. Motil. Cytoskel., 52, 221–230. - PubMed
Publication types
MeSH terms
Grants and funding
LinkOut - more resources
Full Text Sources
Other Literature Sources
Molecular Biology Databases
