

Transurethral high-intensity ultrasound for treatment of stress urinary incontinence (SUI): simulation studies with patient-specific models
- PMID: 29566562
- PMCID: PMC6136964
- DOI: 10.1080/02656736.2018.1456679
Transurethral high-intensity ultrasound for treatment of stress urinary incontinence (SUI): simulation studies with patient-specific models
Abstract
Background: Stress urinary incontinence (SUI) is prevalent in adult women, attributed to weakened endopelvic supporting tissues, and typically treated using drugs and invasive surgical procedures. The objective of this in silico study is to explore transurethral high-intensity ultrasound for delivery of precise thermal therapy to the endopelvic tissues adjacent to the mid-urethra, to induce thermal remodeling as a potential minimally invasive treatment alternative.
Methods: 3D acoustic (Rayleigh-Sommerfeld) and biothermal (Pennes bioheat) models of the ultrasound applicator and surrounding tissues were devised. Parametric studies over transducer configuration [frequency, radius-of-curvature (ROC)] and treatment settings (power, duration) were performed, and select cases on patient-specific models were used for further evaluation. Transient temperature and thermal dose distributions were calculated, and temperature and dose metrics reported.
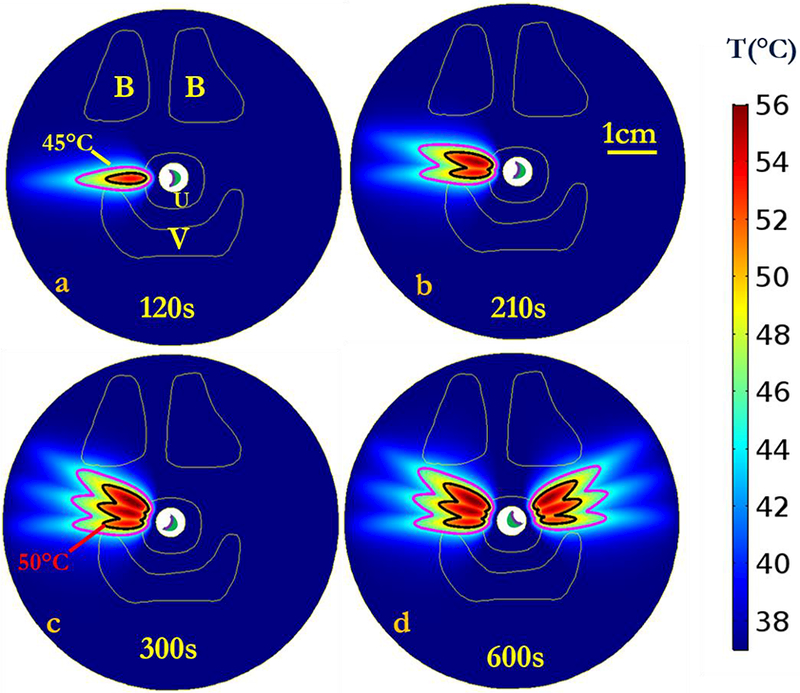
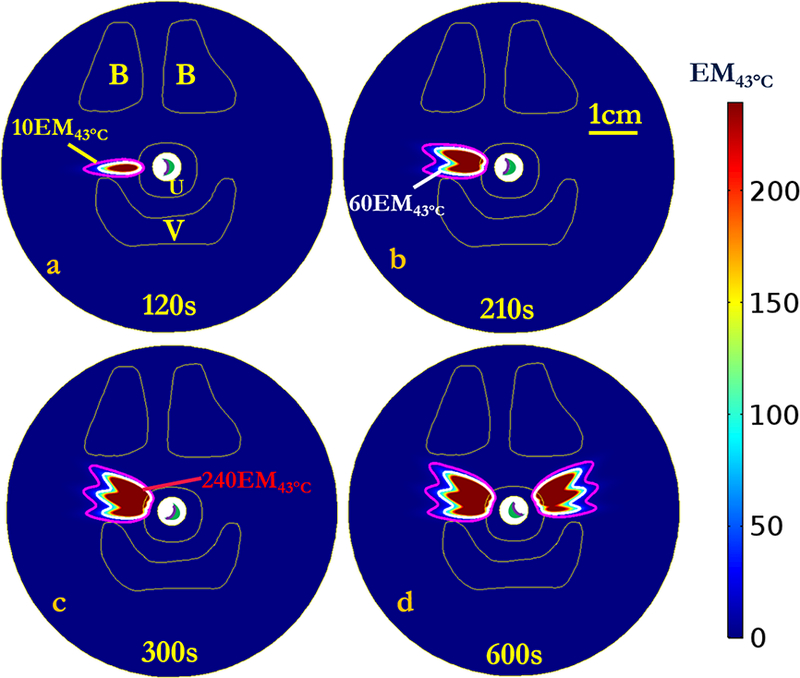
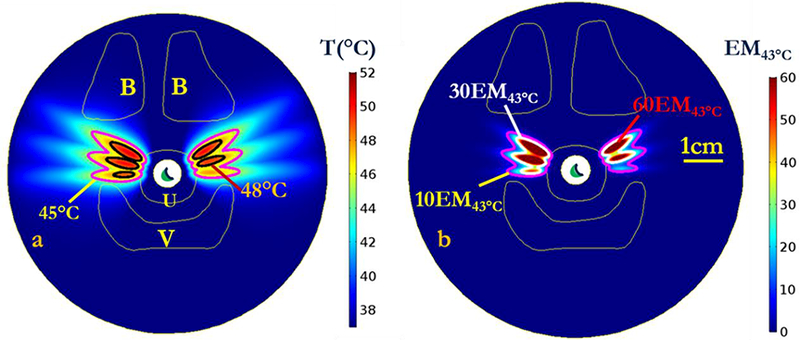
Results: Configurations using a 5-MHz curvilinear transducer (3.5 × 10 mm, 28 mm ROC) with single 90 s sonication can create heated zones with 11 mm penetration (>50 °C) while sparing the inner 1.8 mm (<45 °C) radial depth of the urethral mucosa. Sequential and discrete applicator rotations can sweep out bilateral coagulation volumes (1.4 W power, 15° rotations, 600 s total time), produce large volumetric (1124 mm³ above 60 EM43 °C) and wide angular (∼50.5° per lateral sweep) coverage, with up to 15.6 mm thermal penetration and at least 1.6 mm radial urethral protection (<5 EM43 °C).
Conclusion: Transurethral applicators with curvilinear ultrasound transducers can deliver spatially selective temperature elevations to lateral mid-urethral targets as a possible means to tighten the endopelvic fascia and adjacent tissues.
Keywords: Thermal therapy; high-intensity ultrasound; stress urinary incontinence; therapeutic ultrasound; thermal ablation.
Conflict of interest statement
Declaration of Interest
The authors report no conflicts of interest.
Figures


Similar articles
-
Dual-sectored transurethral ultrasound for thermal treatment of stress urinary incontinence: in silico studies in 3D anatomical models.Med Biol Eng Comput. 2020 Jun;58(6):1325-1340. doi: 10.1007/s11517-020-02152-6. Epub 2020 Apr 10. Med Biol Eng Comput. 2020. PMID: 32277340 Free PMC article.
-
Curvilinear transurethral ultrasound applicator for selective prostate thermal therapy.Med Phys. 2005 Jun;32(6):1555-65. doi: 10.1118/1.1924314. Med Phys. 2005. PMID: 16013714
-
Transurethral ultrasound applicators with dynamic multi-sector control for prostate thermal therapy: in vivo evaluation under MR guidance.Med Phys. 2008 May;35(5):2081-93. doi: 10.1118/1.2900131. Med Phys. 2008. PMID: 18561684 Free PMC article.
-
Catheter-based ultrasound applicators for selective thermal ablation: progress towards MRI-guided applications in prostate.Int J Hyperthermia. 2004 Nov;20(7):739-56. doi: 10.1080/02656730410001721816. Int J Hyperthermia. 2004. PMID: 15675669 Review.
-
Magnetic resonance-guided high-intensity ultrasound ablation of the prostate.Top Magn Reson Imaging. 2006 Jun;17(3):195-207. doi: 10.1097/RMR.0b013e31803774dd. Top Magn Reson Imaging. 2006. PMID: 17414077 Review.
Cited by
-
An endoluminal cylindrical sectored-ring ultrasound phased-array applicator for minimally-invasive therapeutic ultrasound.Med Phys. 2023 Jan;50(1):1-19. doi: 10.1002/mp.16113. Epub 2022 Dec 7. Med Phys. 2023. PMID: 36413363 Free PMC article.
-
Recent Advancements in Hyperthermia-Driven Controlled Drug Delivery from Nanotherapeutics.Recent Adv Drug Deliv Formul. 2022;16(4):270-286. doi: 10.2174/2667387816666220902091043. Recent Adv Drug Deliv Formul. 2022. PMID: 36056855
-
Efficacy of Kegel exercises combined with electrical stimulation on the restoration of postpartum pelvic floor muscle function.Am J Transl Res. 2023 Jan 15;15(1):622-629. eCollection 2023. Am J Transl Res. 2023. PMID: 36777851 Free PMC article.
-
Dual-sectored transurethral ultrasound for thermal treatment of stress urinary incontinence: in silico studies in 3D anatomical models.Med Biol Eng Comput. 2020 Jun;58(6):1325-1340. doi: 10.1007/s11517-020-02152-6. Epub 2020 Apr 10. Med Biol Eng Comput. 2020. PMID: 32277340 Free PMC article.
-
High-intensity focused ultrasound (HIFU) for the treatment of female urinary incontinence: A retrospective analysis.Medicine (Baltimore). 2024 Oct 4;103(40):e39940. doi: 10.1097/MD.0000000000039940. Medicine (Baltimore). 2024. PMID: 39465710 Free PMC article.
References
-
- Dmochowski RR, Blaivas JM, Gormley EA, Juma S, Karram MM, Lightner DJ, et al. Update of AUA guideline on the surgical management of female stress urinary incontinence. The Journal of urology. 2010;183(5):1906–14. - PubMed
-
- Abrams P, Cardozo L, Fall M, Griffiths D, Rosier P, Ulmsten U, et al. The standardisation of terminology of lower urinary tract function: report from the Standardisation Sub-committee of the International Continence Society. American journal of obstetrics and gynecology. 2002; 187(1): 116–26. - PubMed
-
- Hampel C, Wienhold D, Benken N, Eggersmann C, Thüroff J. Definition of overactive bladder and epidemiology of urinary incontinence. Urology. 1997;50(6):4–14. - PubMed
-
- Peyrat L, Haillot O, Bruyere F, Boutin J-M, Bertrand P, Lanson Y. Prevalence and risk factors of urinary incontinence in young and middle-aged women. BJU international. 2002;89(l):61–6. - PubMed
Publication types
MeSH terms
Grants and funding
LinkOut - more resources
Full Text Sources
Other Literature Sources
Medical