

The DNA methylation profile of liver tumors in C3H mice and identification of differentially methylated regions involved in the regulation of tumorigenic genes
- PMID: 29566670
- PMCID: PMC5865360
- DOI: 10.1186/s12885-018-4221-0
The DNA methylation profile of liver tumors in C3H mice and identification of differentially methylated regions involved in the regulation of tumorigenic genes
Abstract
Background: C3H mice have been frequently used in cancer studies as animal models of spontaneous liver tumors and chemically induced hepatocellular carcinoma (HCC). Epigenetic modifications, including DNA methylation, are among pivotal control mechanisms of gene expression leading to carcinogenesis. Although information on somatic mutations in liver tumors of C3H mice is available, epigenetic aspects are yet to be clarified.
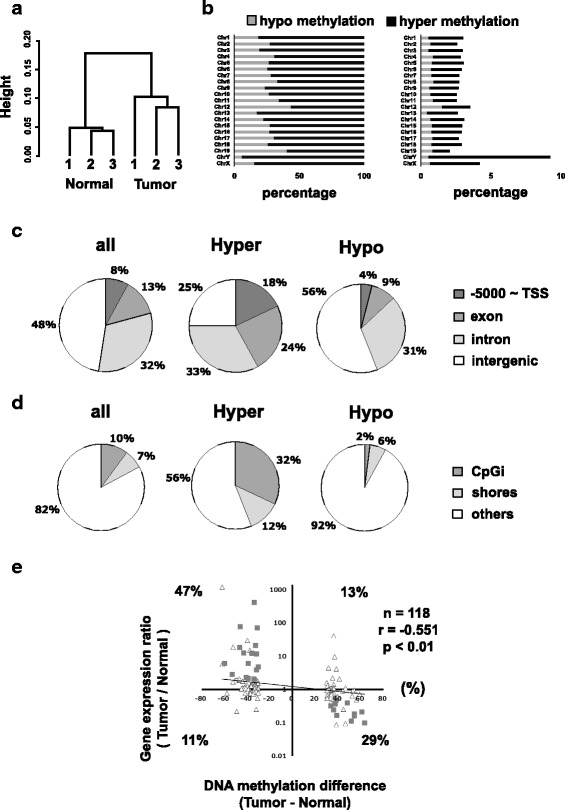
Methods: We performed next generation sequencing-based analysis of DNA methylation and microarray analysis of gene expression to explore genes regulated by DNA methylation in spontaneous liver tumors of C3H mice. Overlaying these data, we selected cancer-related genes whose expressions are inversely correlated with DNA methylation levels in the associated differentially methylated regions (DMRs) located around transcription start sites (TSSs) (promoter DMRs). We further assessed mutuality of the selected genes for expression and DNA methylation in human HCC using the Cancer Genome Atlas (TCGA) database.
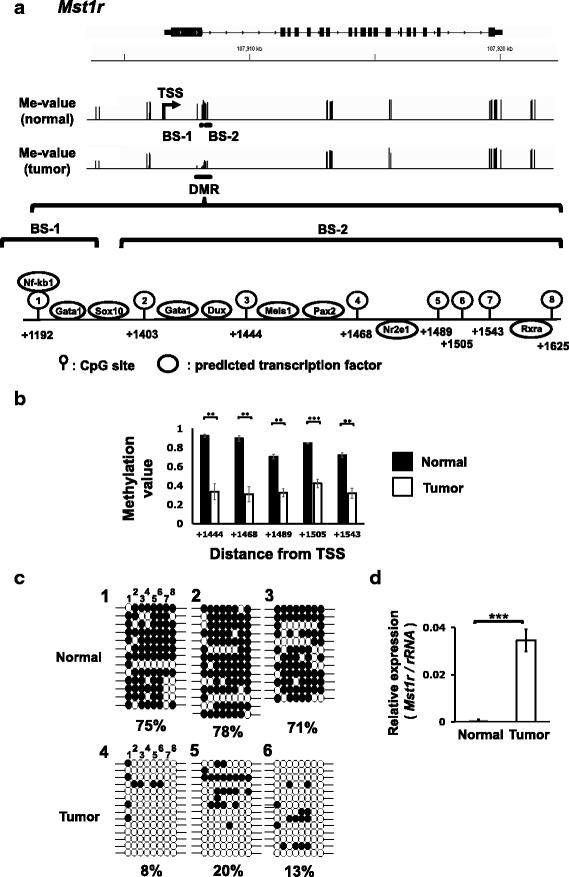
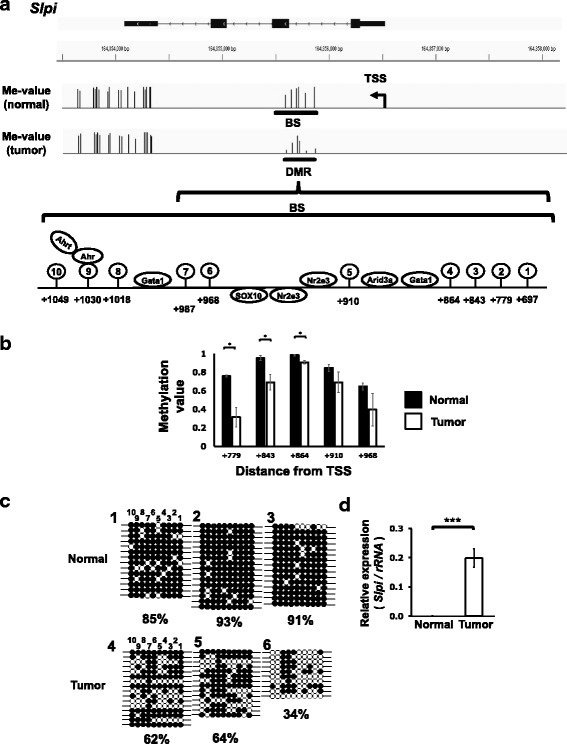
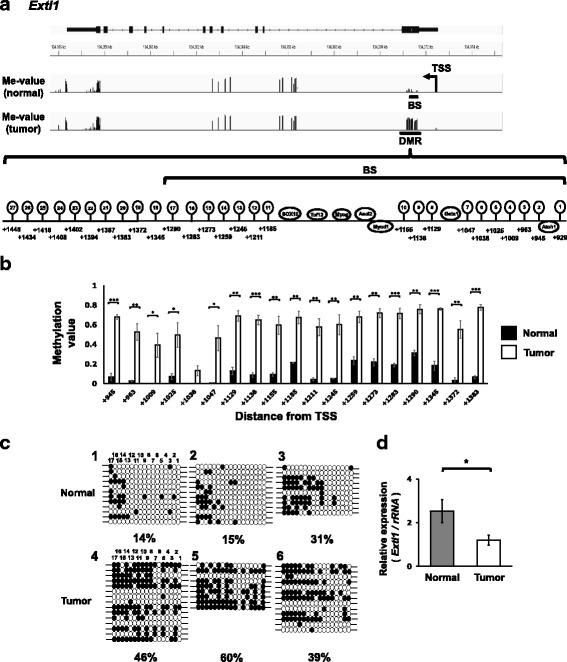
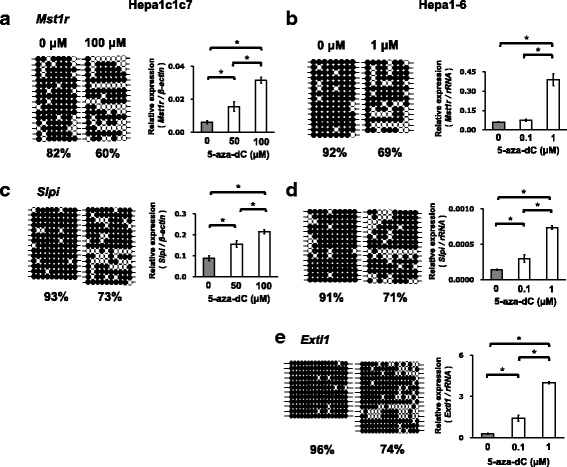
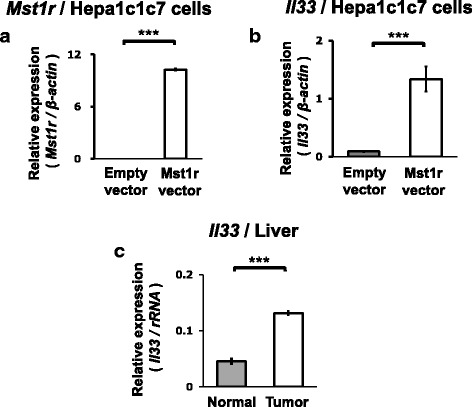
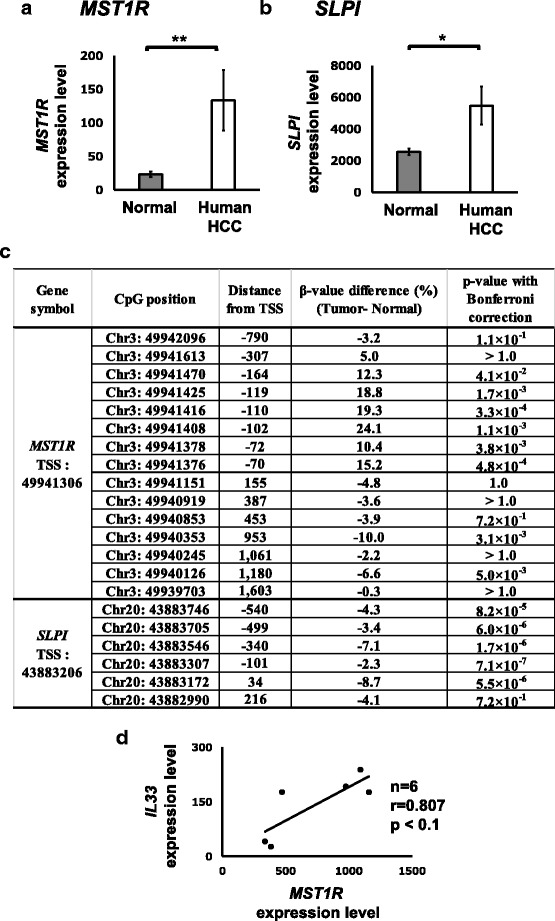
Results: We obtained data on genome-wide DNA methylation profiles in the normal and tumor livers of C3H mice. We identified promoter DMRs of genes which are reported to be related to cancer and whose expressions are inversely correlated with the DNA methylation, including Mst1r, Slpi and Extl1. The association between DNA methylation and gene expression was confirmed using a DNA methylation inhibitor 5-aza-2'-deoxycytidine (5-aza-dC) in Hepa1c1c7 cells and Hepa1-6 cells. Overexpression of Mst1r in Hepa1c1c7 cells illuminated a novel downstream pathway via IL-33 upregulation. Database search indicated that gene expressions of Mst1r and Slpi are upregulated and the TSS upstream regions are hypomethylated also in human HCC. These results suggest that DMRs, including those of Mst1r and Slpi, are involved in liver tumorigenesis in C3H mice, and also possibly in human HCC.
Conclusions: Our study clarified genome wide DNA methylation landscape of C3H mice. The data provide useful information for further epigenetic studies of mice models of HCC. The present study particularly proposed novel DNA methylation-regulated pathways for Mst1r and Slpi, which may be applied not only to mouse HCC but also to human HCC.
Keywords: 5-aza-2'-deoxycytidine; C3H mice; DNA methylation; Liver tumors; Reduced representation bisulfite sequencing (RRBS).
Conflict of interest statement
Ethics approval and consent to participate
Animal studies were permitted by the Animal Care and Use Committee of National Institute for Environmental Studies (NIES) and were performed in accordance with guideline for the Care and Use of Laboratory Animals of NIES.
The results on human HCC shown in Fig. 7 are based on existing data generated by The Cancer Genome Atlas project established by the NCI and NHGRI
Consent for publication
Not applicable.
Competing interests
The authors declare that they have no competing interests.
Publisher’s Note
Springer Nature remains neutral with regard to jurisdictional claims in published maps and institutional affiliations.
Figures
Similar articles
-
Identification by TCGA database search of five genes that are aberrantly expressed and involved in hepatocellular carcinoma potentially via DNA methylation changes.Environ Health Prev Med. 2020 Jul 23;25(1):31. doi: 10.1186/s12199-020-00871-8. Environ Health Prev Med. 2020. PMID: 32703154 Free PMC article.
-
Using Illumina Infinium HumanMethylation 450K BeadChip to explore genome‑wide DNA methylation profiles in a human hepatocellular carcinoma cell line.Mol Med Rep. 2018 Nov;18(5):4446-4456. doi: 10.3892/mmr.2018.9441. Epub 2018 Sep 3. Mol Med Rep. 2018. PMID: 30221710 Free PMC article.
-
Methylome analysis and integrative profiling of human HCCs identify novel protumorigenic factors.Hepatology. 2012 Nov;56(5):1817-27. doi: 10.1002/hep.25870. Epub 2012 Oct 14. Hepatology. 2012. PMID: 22689435
-
Integrative analysis of aberrant Wnt signaling in hepatitis B virus-related hepatocellular carcinoma.World J Gastroenterol. 2015 May 28;21(20):6317-28. doi: 10.3748/wjg.v21.i20.6317. World J Gastroenterol. 2015. PMID: 26034368 Free PMC article. Review.
-
Clinical implications of DNA methylation in hepatocellular carcinoma.HPB (Oxford). 2011 Jun;13(6):369-76. doi: 10.1111/j.1477-2574.2011.00303.x. Epub 2011 Mar 29. HPB (Oxford). 2011. PMID: 21609368 Free PMC article. Review.
Cited by
-
Direct genetic transformation bypasses tumor-associated DNA methylation alterations.Genome Biol. 2025 Jul 17;26(1):212. doi: 10.1186/s13059-025-03650-2. Genome Biol. 2025. PMID: 40676699 Free PMC article.
-
DNA methylation changes involved in the tumor increase in F2 males born to gestationally arsenite-exposed F1 male mice.Cancer Sci. 2019 Aug;110(8):2629-2642. doi: 10.1111/cas.14104. Epub 2019 Jul 25. Cancer Sci. 2019. PMID: 31215104 Free PMC article.
-
From genome sequencing to the discovery of potential biomarkers in liver disease.BMB Rep. 2020 Jun;53(6):299-310. doi: 10.5483/BMBRep.2020.53.6.074. BMB Rep. 2020. PMID: 32475383 Free PMC article. Review.
-
Gestational arsenic exposure induces site-specific DNA hypomethylation in active retrotransposon subfamilies in offspring sperm in mice.Epigenetics Chromatin. 2020 Dec 2;13(1):53. doi: 10.1186/s13072-020-00375-3. Epigenetics Chromatin. 2020. PMID: 33267854 Free PMC article.
-
Deregulation of the Histone Lysine-Specific Demethylase 1 Is Involved in Human Hepatocellular Carcinoma.Biomolecules. 2019 Dec 1;9(12):810. doi: 10.3390/biom9120810. Biomolecules. 2019. PMID: 31805626 Free PMC article.
References
-
- Delgado E, Okabe H, Preziosi M, Russell JO, Alvarado TF, Oertel M, Nejak-Bowen KN, Zhang Y, Monga SP. Complete response of Ctnnb1-mutated tumours to beta-catenin suppression by locked nucleic acid antisense in a mouse hepatocarcinogenesis model. J Hepatol. 2015;62(2):380–387. doi: 10.1016/j.jhep.2014.10.021. - DOI - PMC - PubMed
Publication types
MeSH terms
Substances
Grants and funding
LinkOut - more resources
Full Text Sources
Other Literature Sources
Medical
Molecular Biology Databases
Research Materials
