

Cognitive impairment in metabolically-obese, normal-weight rats: identification of early biomarkers in peripheral blood mononuclear cells
- PMID: 29566703
- PMCID: PMC5863821
- DOI: 10.1186/s13024-018-0246-8
Cognitive impairment in metabolically-obese, normal-weight rats: identification of early biomarkers in peripheral blood mononuclear cells
Abstract
Background: Metabolically-obese, normal-weight (MONW) individuals are not obese in terms of weight and height but have a number of obesity-related features (e.g. greater visceral adiposity, insulin resistance, and increased risk of cardiovascular disease). The MONW phenotype is related to the intake of unbalanced diets, such as those rich in fat. Increasing evidence shows a relationship between high-fat diet consumption and mild cognitive impairment and dementia. Thus, MONW individuals could be at a greater risk of cognitive dysfunction. We aimed to evaluate whether MONW-like animals present gene expression alterations in the hippocampus associated with an increased risk of cognitive impairment, and to identify early biomarkers of cognitive dysfunction in peripheral blood mononuclear cells (PBMC).
Methods: Wistar rats were chronically fed with a 60% (HF60) or a 45% (HF45) high-fat diet administered isocalorically to control animals to mimic MONW features. Expression analysis of cognitive decline-related genes was performed using RT-qPCR, and working memory was assessed using a T-maze.
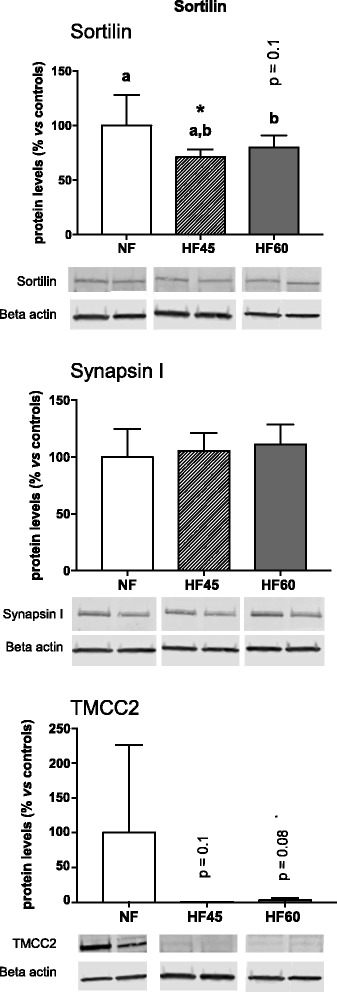
Results: High-fat diet consumption altered the pattern of gene expression in the hippocampus, clearly pointing to cognitive decline, which was accompanied by a worse performance in the T-maze in HF60 animals. Remarkably, Syn1 and Sorl1 mRNA showed the same expression pattern in both the hippocampus and the PBMC obtained at different time-points in the HF60 group, even before other pathological signs were observed.
Conclusions: Our results demonstrate that long-term intake of high-fat diets, even in the absence of obesity, leads to cognitive disruption that is reflected in PBMC transcriptome. Therefore, PBMC are revealed as a plausible, minimally-invasive source of early biomarkers of cognitive impairment associated with increased fat intake.
Keywords: Blood cells; Hippocampus; MCI; MONW.
Conflict of interest statement
Ethics approval and consent to participate
The animal protocol followed in this study was reviewed and approved by the Bioethical Committee of the University of the Balearic Islands, and university guidelines for the use and care of laboratory animals were followed.
Competing interests
The authors declare that they have no competing interests.
Publisher’s Note
Springer Nature remains neutral with regard to jurisdictional claims in published maps and institutional affiliations.
Figures


Similar articles
-
PBMC transcriptome reveals an early metabolic risk profile in young rats with metabolically obese, normal-weight phenotype.J Nutr Biochem. 2025 Feb;136:109790. doi: 10.1016/j.jnutbio.2024.109790. Epub 2024 Oct 26. J Nutr Biochem. 2025. PMID: 39490909
-
The Metabolically Obese, Normal-Weight Phenotype in Young Rats Is Associated with Cognitive Impairment and Partially Preventable with Leptin Intake during Lactation.Int J Mol Sci. 2023 Dec 22;25(1):228. doi: 10.3390/ijms25010228. Int J Mol Sci. 2023. PMID: 38203399 Free PMC article.
-
The intake of high-fat diets induces an obesogenic-like gene expression profile in peripheral blood mononuclear cells, which is reverted by dieting.Br J Nutr. 2016 Jun;115(11):1887-95. doi: 10.1017/S0007114516001173. Epub 2016 Apr 15. Br J Nutr. 2016. PMID: 27080153
-
The metabolically obese, normal-weight individual revisited.Diabetes. 1998 May;47(5):699-713. doi: 10.2337/diabetes.47.5.699. Diabetes. 1998. PMID: 9588440 Review.
-
Lean, but not healthy: the 'metabolically obese, normal-weight' phenotype.Curr Opin Clin Nutr Metab Care. 2016 Nov;19(6):408-417. doi: 10.1097/MCO.0000000000000317. Curr Opin Clin Nutr Metab Care. 2016. PMID: 27552473 Review.
Cited by
-
High-fat diet-associated cognitive decline: Is zinc finger protein 1 (ZPR1) the molecular connection?Curr Res Physiol. 2021 Oct 2;4:223-228. doi: 10.1016/j.crphys.2021.09.004. eCollection 2021. Curr Res Physiol. 2021. PMID: 34746842 Free PMC article. Review.
-
High levels of plasma fibrinogen are related to post-stroke cognitive impairment.Brain Behav. 2019 Oct;9(10):e01391. doi: 10.1002/brb3.1391. Epub 2019 Sep 2. Brain Behav. 2019. PMID: 31475471 Free PMC article.
-
Ablation of Tmcc2 Gene Impairs Erythropoiesis in Mice.Int J Mol Sci. 2022 May 9;23(9):5263. doi: 10.3390/ijms23095263. Int J Mol Sci. 2022. PMID: 35563652 Free PMC article.
-
[Quantitative analysis of differential proteins in liver tissues of patients with non-alcoholic steatohepatitis using iTRAQ technology].Nan Fang Yi Ke Da Xue Xue Bao. 2021 Aug 31;41(9):1381-1387. doi: 10.12122/j.issn.1673-4254.2021.09.13. Nan Fang Yi Ke Da Xue Xue Bao. 2021. PMID: 34658353 Free PMC article. Chinese.
-
Increased mRNA Levels of ADAM17, IFITM3, and IFNE in Peripheral Blood Cells Are Present in Patients with Obesity and May Predict Severe COVID-19 Evolution.Biomedicines. 2022 Aug 18;10(8):2007. doi: 10.3390/biomedicines10082007. Biomedicines. 2022. PMID: 36009555 Free PMC article.
References
-
- Diagnostic and Statistical Manual of Mental disorders . DSM iv-TR. 4. Washington D.C.: American Psychiatric Association; 2000.
-
- Gustafson DR, Backman K, Joas E, Waern M, Ostling S, Guo X, Skoog I. 37 years of body mass index and dementia: observations from the prospective population study of women in Gothenburg, Sweden. J Alzheimers Dis. 2012;28(1):163–171. - PubMed
Publication types
MeSH terms
Substances
Grants and funding
LinkOut - more resources
Full Text Sources
Other Literature Sources
Molecular Biology Databases
