

Growth differentiation factor 15 contributes to marrow adipocyte remodeling in response to the growth of leukemic cells
- PMID: 29566722
- PMCID: PMC5863796
- DOI: 10.1186/s13046-018-0738-y
Growth differentiation factor 15 contributes to marrow adipocyte remodeling in response to the growth of leukemic cells
Abstract
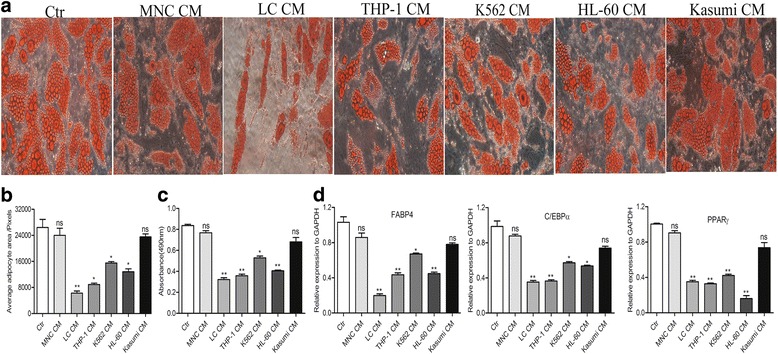
Background: The adipocyte remodeling, including of the morphological change, might indicate special pathological function. Our previous study found that the morphological remodeling of larger marrow adipocytes into small marrow adipocytes correlates with a poor prognosis for acute myeloid leukemia (AML) patients. However, the mechanisms contributed to the marrow adipocyte remodeling are still poorly understood.
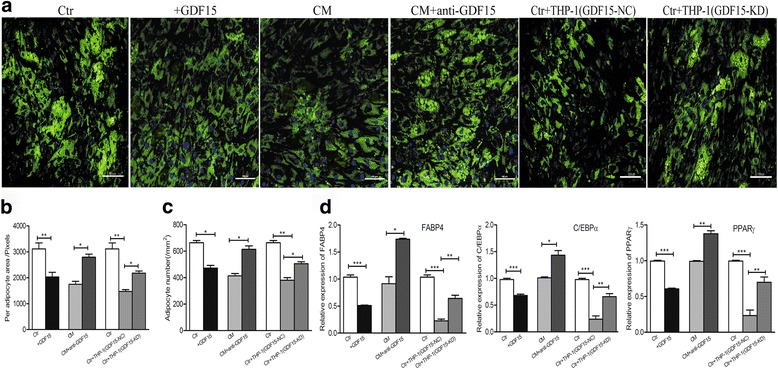
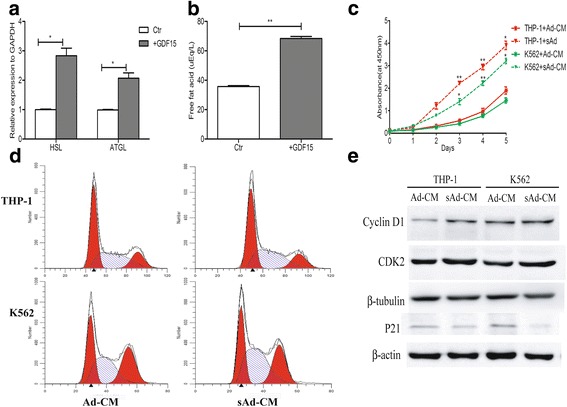
Methods: GDF15 expression was analyzed by RT-qPCR and western blotting assays in the leukemic cells. The enhancing and antibody neutralization tests in vitro were employed to evaluate the effect of GDF15 on the morphology of mature adipocytes. CCK8 test was used to detect the proliferation of leukemic cells after co-cultivation with small marrow adipocytes. Flow cytometry was used to analysis the proportion of cell cycle of leukemic cells. Immunofluorescence staining and linear analysis were applied to verify the GDF15 expression and the relationship between GDF15 and small marrow adipocytes in AML patients.
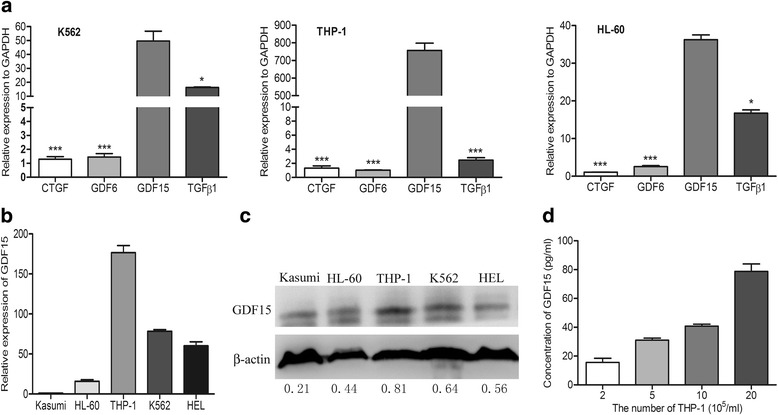
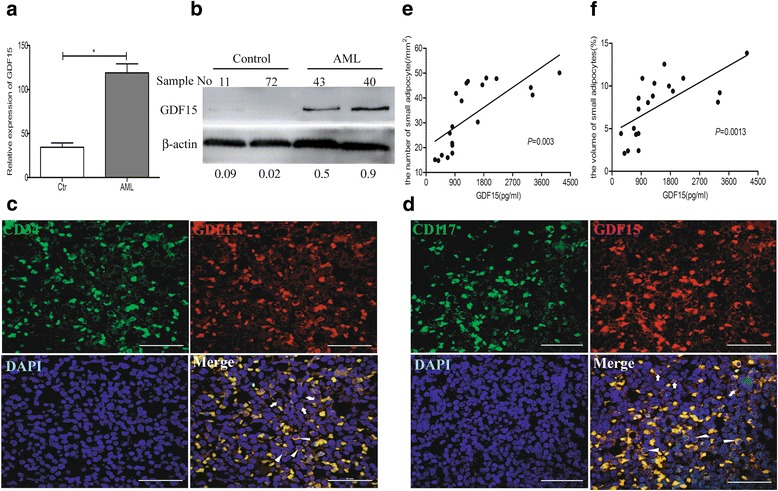
Results: In this study, we found that leukemic cell lines not only expressed significantly higher growth differentiation factor 15 (GDF15) than the other three cytokines associated with adipocyte differentiation in RNA level but also secreted GDF15 factor. Furthermore, the in vitro experiments demonstrated that GDF15 was involved in the conversion of small marrow adipocytes from larger marrow adipocytes. Correspondingly, the leukemic cells proliferated more rapidly through regulating the cell cycle when co-cultured with GDF15-induced small marrow adipocytes. The immunofluorescence staining on the bone marrow sections of AML patients further exhibited that GDF15 was partly produced by leukemic cells. The positive correlation between the concentration of GDF15 in the marrow aspirates and the number and the volume of small marrow adipocytes might suggest the contribution of GDF15 in AML patients (r = 0.72, r = 0.67).
Conclusions: GDF15 secreted by leukemic cells was involved in the morphological remodeling of marrow adipocytes, which can in turn promote leukemic cell growth, indicating that GDF15 may be a promising treatment target for AML patients.
Keywords: Acute myeloid leukemia; Adipocyte remodeling; GDF15; Marrow adipocyte.
Conflict of interest statement
Ethics approval and consent to participate
Not applicable.
Consent for publication
Not applicable.
Competing interests
The authors declare that they have no competing interests.
Publisher’s Note
Springer Nature remains neutral with regard to jurisdictional claims in published maps and institutional affiliations.
Figures
Similar articles
-
Role of bone marrow adipocytes in leukemia and chemotherapy challenges.Cell Mol Life Sci. 2019 Jul;76(13):2489-2497. doi: 10.1007/s00018-019-03031-6. Epub 2019 Feb 4. Cell Mol Life Sci. 2019. PMID: 30715556 Free PMC article. Review.
-
Consolidation Chemotherapy Prevents Relapse by Indirectly Regulating Bone Marrow Adipogenesis in Patients with Acute Myeloid Leukemia.Cell Physiol Biochem. 2018;45(6):2389-2400. doi: 10.1159/000488225. Epub 2018 Mar 13. Cell Physiol Biochem. 2018. PMID: 29550830
-
Growth differentiation factor 15 contributes to cancer-associated fibroblasts-mediated chemo-protection of AML cells.J Exp Clin Cancer Res. 2016 Sep 19;35(1):147. doi: 10.1186/s13046-016-0405-0. J Exp Clin Cancer Res. 2016. PMID: 27643489 Free PMC article.
-
Leukemia cells remodel marrow adipocytes via TRPV4-dependent lipolysis.Haematologica. 2020 Nov 1;105(11):2572-2583. doi: 10.3324/haematol.2019.225763. Haematologica. 2020. PMID: 33131246 Free PMC article.
-
The bone marrow microenvironment - Home of the leukemic blasts.Blood Rev. 2017 Sep;31(5):277-286. doi: 10.1016/j.blre.2017.03.004. Epub 2017 Mar 12. Blood Rev. 2017. PMID: 28318761 Review.
Cited by
-
Indirubin, a small molecular deriving from connectivity map (CMAP) screening, ameliorates obesity-induced metabolic dysfunction by enhancing brown adipose thermogenesis and white adipose browning.Nutr Metab (Lond). 2020 Mar 16;17:21. doi: 10.1186/s12986-020-00440-4. eCollection 2020. Nutr Metab (Lond). 2020. PMID: 32190098 Free PMC article.
-
Transforming the Niche: The Emerging Role of Extracellular Vesicles in Acute Myeloid Leukaemia Progression.Int J Mol Sci. 2024 Apr 17;25(8):4430. doi: 10.3390/ijms25084430. Int J Mol Sci. 2024. PMID: 38674015 Free PMC article. Review.
-
Role of bone marrow adipocytes in leukemia and chemotherapy challenges.Cell Mol Life Sci. 2019 Jul;76(13):2489-2497. doi: 10.1007/s00018-019-03031-6. Epub 2019 Feb 4. Cell Mol Life Sci. 2019. PMID: 30715556 Free PMC article. Review.
-
Prognostic Impact of Serum Growth Differentiation Factor 15 Level in Acute Myeloid Leukemia Patients.Indian J Hematol Blood Transfus. 2021 Jan;37(1):37-44. doi: 10.1007/s12288-020-01315-7. Epub 2020 Jun 30. Indian J Hematol Blood Transfus. 2021. PMID: 33707833 Free PMC article.
-
PSMB10 maintains the stemness of chemotherapeutic drug-resistant leukemia cells by inhibiting senescence and cytotoxic T lymphocyte-mediated killing in a ubiquitinated degradation manner.J Exp Clin Cancer Res. 2025 Jun 3;44(1):170. doi: 10.1186/s13046-025-03420-9. J Exp Clin Cancer Res. 2025. PMID: 40462177 Free PMC article.
References
-
- Tabe Y, Konopleva M, Munsell MF, Marini FC, Zompetta C, McQueen T, Tsao T, Zhao S, Pierce S, Igari J, et al. PML-RARalpha is associated with leptin-receptor induction: the role of mesenchymal stem cell-derived adipocytes in APL cell survival. Blood. 2004;103:1815–1822. doi: 10.1182/blood-2003-03-0802. - DOI - PubMed
MeSH terms
Substances
Grants and funding
LinkOut - more resources
Full Text Sources
Other Literature Sources
Medical
