. 2018 Mar 22;9(1):74.
doi: 10.1186/s13287-018-0829-x.

Stem cell properties of human clonal salivary gland stem cells are enhanced by three-dimensional priming culture in nanofibrous microwells

Affiliations

Stem cell properties of human clonal salivary gland stem cells are enhanced by three-dimensional priming culture in nanofibrous microwells

Hyun-Soo Shin et al. Stem Cell Res Ther. .

Abstract

Background: Three-dimensional (3D) cultures recapitulate the microenvironment of tissue-resident stem cells and enable them to modulate their properties. We determined whether salivary gland-resident stem cells (SGSCs) are primed by a 3D spheroid culture prior to treating irradiation-induced salivary hypofunction using in-vitro coculture and in-vivo transplant models.

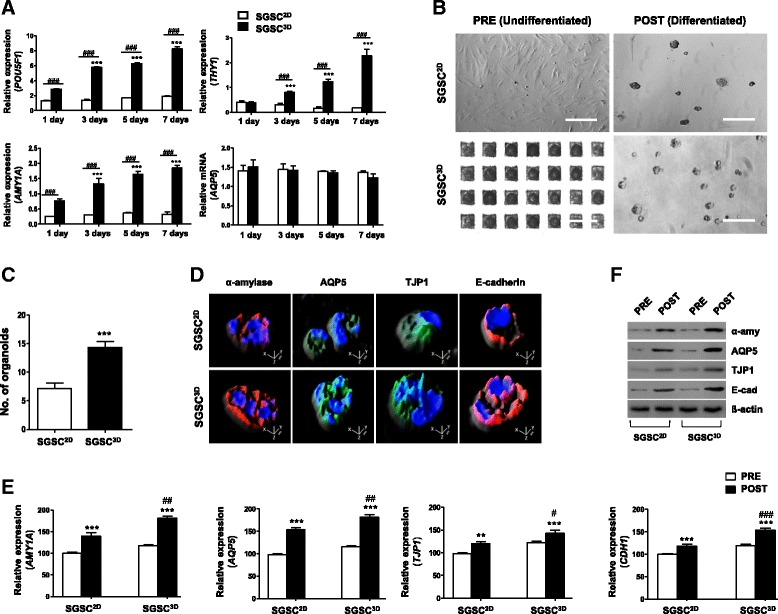
Methods: 3D spheroid-derived SGSCs (SGSCs3D) were obtained from 3D culture in microwells consisting of a nanofiber bottom and cell-repellent hydrogel walls, and were examined for salivary stem or epithelial gene/protein expression, differentiation potential, and paracrine secretory function compared with monolayer-cultured SGSCs (SGSCs2D) in vitro and in vivo.

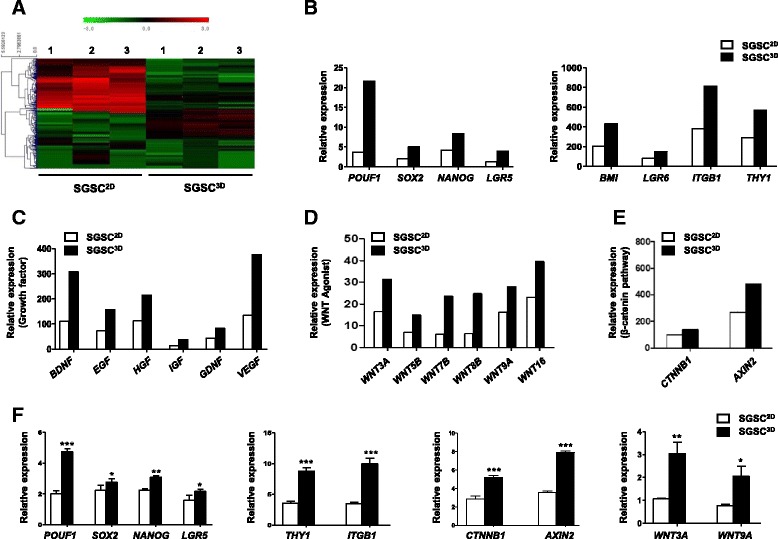
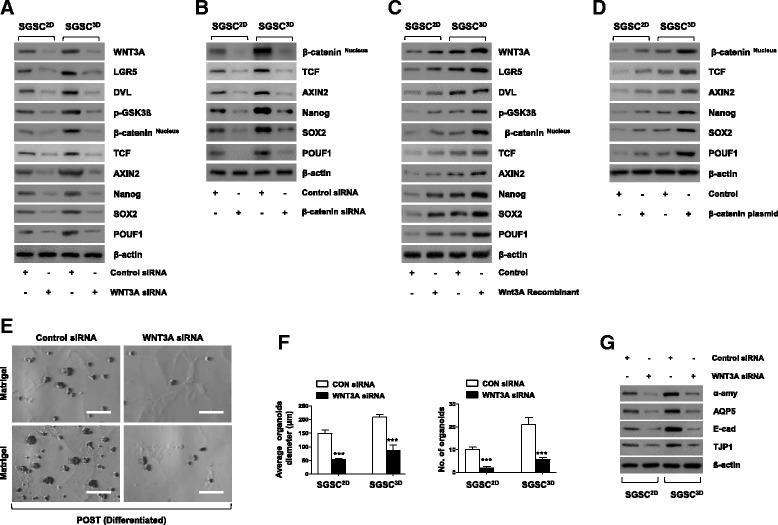
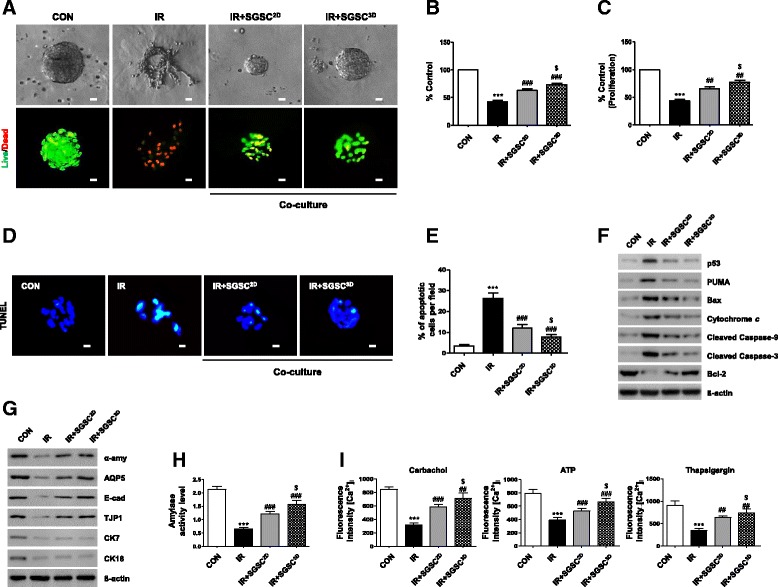
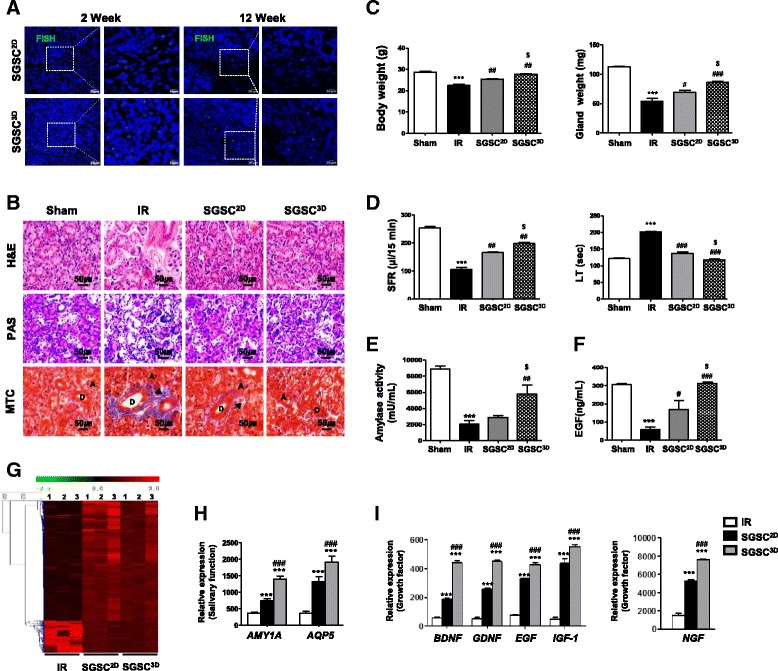
Results: SGSCs3D expressed increased salivary stem cell markers (LGR5 and THY1) and pluripotency markers (POU5F1 and NANOG) compared with SGSCs2D. Also, SGSCs3D exhibited enhanced potential to differentiate into salivary epithelial cells upon differentiation induction and increased paracrine secretion as compared to SGSCs2D. Wnt signaling was activated by 3D spheroid formation in the microwells and suppression of the Wnt/β-catenin pathway led to reduced stemness of SGSCs3D. Enhanced radioprotective properties of SGSCs3D against radiation-induced salivary hypofunction was confirmed by an organotypic 3D coculture and in-vivo transplantation experiments.

Conclusion: The 3D spheroid culture of SGSCs in nanofibrous microwells promotes stem cell properties via activation of Wnt signaling. This may contribute to SGSC priming prior to regenerative therapy to restore salivary hypofunction after radiotherapy.

Keywords: Micropatterned nanofibrous scaffolds; Salivary glands; Spheroid; Wnt; Xerostomia.


Conflict of interest statement

Ethics approval

Procedures and maintenance were performed in accordance with the Institutional Guidelines and Use Committee approved by the Institutional Animal Ethics Committee (Permit Number 150716–371).

Consent for publication

Not applicable.

Competing interests

The authors declare that they have no competing interests.

Publisher’s Note

Springer Nature remains neutral with regard to jurisdictional claims in published maps and institutional affiliations.

Figures

Fig. 1
Fig. 1
Enhanced differentiation potential of 3D-assembled SGSC spheroids. a Transcription levels of salivary acinar (AMY1A and AQP5) and stem cell-related (POU5F1 and THY1) markers compared by qPCR at 1, 3, 5, and 7 days between 2D monolayer-cultured SGSCs (SGSCs2D) and 3D spheroid-derived SGSCs (SGSCs3D) culture. Data from three independent experiments analyzed and presented as mean ± SEM (n = 3). Two-way ANOVA, Bonferroni’s post hoc test. *Compared with Day 1; #compared with SGSCs2D in each group. b Light microscope images of SGSCs after differentiation. Scale bars represent 400 μm. c Differentiation capacity determined by measuring average number of acinus-like organoids per plate after plating same number of cells. Data from five independent experiments analyzed and presented as mean ± SEM (n = 5). One-way ANOVA; Tukey’s post hoc test. *Compared with monolayer-cultured salivary gland-resident stem cells (SGSCs2D). d Immunofluorescent images representing salivary acinar markers α-amylase (red) and AQP5 (green), tight junction protein TJP1 (green), and adherence protein E-cadherin (red). Scale bars represent 20 μm. e mRNA levels of SG acinar cell markers (AMY1A and AQP5), tight junction gene (TJP1), and intercellular adherence gene (CDH1) determined by real-time PCR in SGSC2D and SGSC3D cultures after differentiation. All qPCR measurements performed in triplicate. f Protein levels of α-amylase, AQP5, TJP1, and E-cadherin determined by western blotting in SGSC2D and SGSC3D cultures after differentiation. **P < 0.01, ***P < 0.001, #P < 0.05, ##P < 0.01, ###P < 0.001. SGSC salivary gland-resident stem cell
Fig. 2
Fig. 2
Effects of 3D priming culture on stemness and paracrine secretion. a Heat map showing differential expression of genes in microarrays of monolayer-cultured SGSCs (SGSCs2D) and 3D spheroid-derived SGSCs (SGSCs3D). DEGs (> 2-fold) quantified and antibody reactivity intensity indicated as red pixels (values > 2-fold) and green pixels (values < 2-fold). Stem cell-related genes (b), growth factor genes (c), and WNT-β-catenin-related genes (d, e) in SGSCs3D after whole-genome microarray analysis compared with SGSCs2D. f Confirmation of microarray results for stem cell markers and WNT-β-catenin-related markers after real-time PCR. Data from three independent experiments analyzed and presented as mean ± SEM (n = 3). One-way ANOVA; Tukey’s post hoc test. *Compared with SGSCs2D. *P < 0.05, **P < 0.01, ***P < 0.001. SGSC salivary gland-resident stem cell, EGF epidermal growth factor, HGF hepatocyte growth factor, IGF insulin growth factor, VEGF vascular endothelial growth factor, BDNF brain-derived neurotrophic factor, GDNF glial cell line-derived neurotrophic factor
Fig. 3
Fig. 3
WNT activation and signaling following priming in 3D microwell culture. a, b Presence of WNT3A and β-catenin siRNA suppressed expression of WNT-β-catenin-related and stem cell-related proteins. c, d Recombinant WNT3A and β-catenin plasmid upregulated WNT3A-β-catenin-related and stem cell-related proteins. e Knockdown of WNT3A reduced differentiation capacity of SGSCs and decreased formation of acinus-like organoids. Scale bars represent 100 μm. f Diameter of acinus-like organoids normalized to total number of spheroids measured after knockdown of WNT3A. Differentiation capacity also determined by measuring average number of organoids per plate after plating same number of cells. Data from five independent experiments analyzed and presented as mean ± SEM (n = 5). One-way ANOVA; Tukey’s post hoc test. *Compared with control siRNA. ***P < 0.001. g Protein levels of SG acinar cell markers (α-amylase and AQP5), tight junction proteins (TJP1), and intercellular adherence protein (E-cadherin) determined by western blotting in acinus-like organoids after induction of differentiation in presence of WNT3A siRNA. SGSC salivary gland-resident stem cell, SGSCs2D monolayer-cultured SGSCs, SGSCs3D 3D spheroid-derived SGSCs, siRNA small interfering RNA, CON control
Fig. 4
Fig. 4
Radioprotective effects of 3D spheroid-derived SGSCs (SGSCs3D) in a coculture model. ac Effects of SGSCs3D on IR-induced changes in cell morphology, viability, and proliferation of human parotid epithelial cells (hPECs). Scale bars represent 20 μm. Datasets from three independent experiments (n = 3). d Terminal deoxynucleotidyl transferase (TdT) dUTP nick-end labeling (TUNEL) assays. e Comparison of percentages of TUNEL-positive apoptotic cells among groups. Data from three independent experiments presented as mean number of apoptotic cells per field ± SEM (n = 3). f Western blotting analysis of proapoptotic and antiapoptotic protein levels. g Protein levels of salivary acinar markers (α-amylase and AQP5), ductal markers (CK7 and CK18), tight junction protein (TJP1), and adherence protein (E-cadherin) determined by western blotting. h Effects of SGSCs2D and SGSCs3D on amylase secretion in hPECs. Amylase activities per wells containing 105 hPECs examined using assay kit. Data from three independent experiments analyzed and presented as mean ± SEM (n = 3). i Intracellular Ca2+ levels measured at baseline and upon stimulation with an agonist. Data presented as mean fluorescence intensity ± SEM. Data from three independent experiments analyzed and presented as mean fluorescent intensity ± SEM (n = 3). Two-way ANOVA, Bonferroni’s post hoc test. *Compared to CON in each group; #compared to IR in each group; $compared to SGSCs2D in each group. ***P < 0.001, ##P < 0.01, ###P < 0.001, $P < 0.05. CON control, IR irradiation, SGSC salivary gland-resident stem cell, SGSCs2D monolayer-cultured SGSCs, [Ca2+]i intracellular calcium
Fig. 5
Fig. 5
3D-primed salivary gland-resident stem cells (SGSCs) restore IR-induced salivary gland hypofunction in vivo. a Fluorescent in-situ hybridization (FISH) analysis. b Representative histological images of hematoxylin and eosin (H&E), Periodic acid Schiff (PAS), and Masson’s trichrome (MTC) staining from three groups at 12 weeks post IR. Scale bars represent 50 μm. A acinar, D duct. Arrow: fibrosis. c Body and gland weights measured at 16 weeks after treatment. d Salivary flow rate (SFR) calculated at 16 weeks. Changes in SFR after IR expressed as ratio of post-IR SFR to pre-IR SFR (mean ± SEM). Time to salivation (lag time (LT)) measured and ratios of post-IR LT to pre-IR LT presented. e Salivary amylase activity examined using assay kit and fold-changes in activity levels presented. f EGF content measured at each time point and average concentrations presented. Data presented as mean ± SEM. One-way ANOVA; Tukey’s post-hoc test. *Compared with Sham group; #compared with IR group; $compared with SGSC2D group. ***P < 0.001, #P < 0.05, ##P < 0.01, ###P < 0.001, $P < 0.05. g Differentially regulated genes (> 2-fold) quantified and presented in a heat map indicating antibody reactivity intensity as red (values > 2-fold) and green (values < 2-fold) pixels. h, i Salivary acinar and growth factor genes in SGSC3D group after whole-genome microarray analysis and comparison with IR and SGSC2D groups. One-way ANOVA; Tukey’s post-hoc test. *Compared with IR group; #compared with SGSC2D group. ***P < 0.001, ###P < 0.001. SGSCs2D monolayer-cultured SGSCs, SGSCs3D 3D spheroid-derived SGSCs, IR irradiation, EGF epidermal growth factor

Similar articles

Cited by

References

    1. Zomer HD, Vidane AS, Goncalves NN, Ambrosio CE. Mesenchymal and induced pluripotent stem cells: general insights and clinical perspectives. Stem Cells Cloning. 2015;8:125–134. - PMC - PubMed
    1. Squillaro T, Peluso G, Galderisi U. Clinical trials with mesenchymal stem cells: an update. Cell Transplant. 2016;25:829–848. doi: 10.3727/096368915X689622. - DOI - PubMed
    1. Ma T, Sun J, Zhao Z, Lei W, Chen Y, Wang X, Yang J, Shen Z. A brief review: adipose-derived stem cells and their therapeutic potential in cardiovascular diseases. Stem Cell Res Ther. 2017;8:124. doi: 10.1186/s13287-017-0585-3. - DOI - PMC - PubMed
    1. Lane SW, Williams DA, Watt FM. Modulating the stem cell niche for tissue regeneration. Nat Biotechnol. 2014;32:795–803. doi: 10.1038/nbt.2978. - DOI - PMC - PubMed
    1. Peerani R, Zandstra PW. Enabling stem cell therapies through synthetic stem cell-niche engineering. J Clin Invest. 2010;120:60–70. doi: 10.1172/JCI41158. - DOI - PMC - PubMed

Publication types

MeSH terms