

Transcriptomic characterization of MRI contrast with focus on the T1-w/T2-w ratio in the cerebral cortex
- PMID: 29567503
- PMCID: PMC6450807
- DOI: 10.1016/j.neuroimage.2018.03.027
Transcriptomic characterization of MRI contrast with focus on the T1-w/T2-w ratio in the cerebral cortex
Abstract
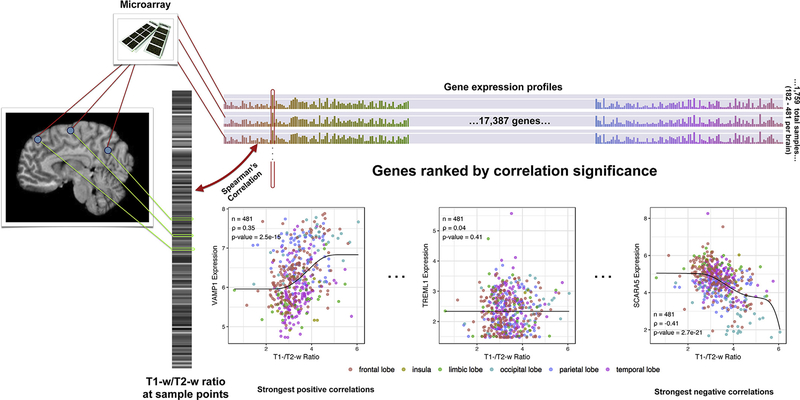
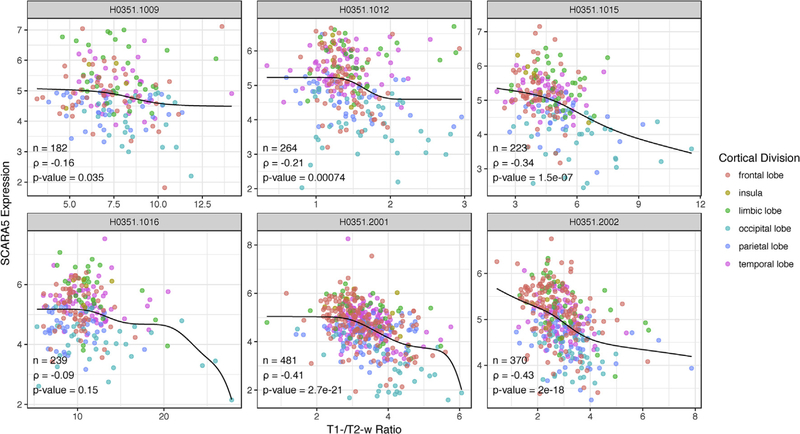
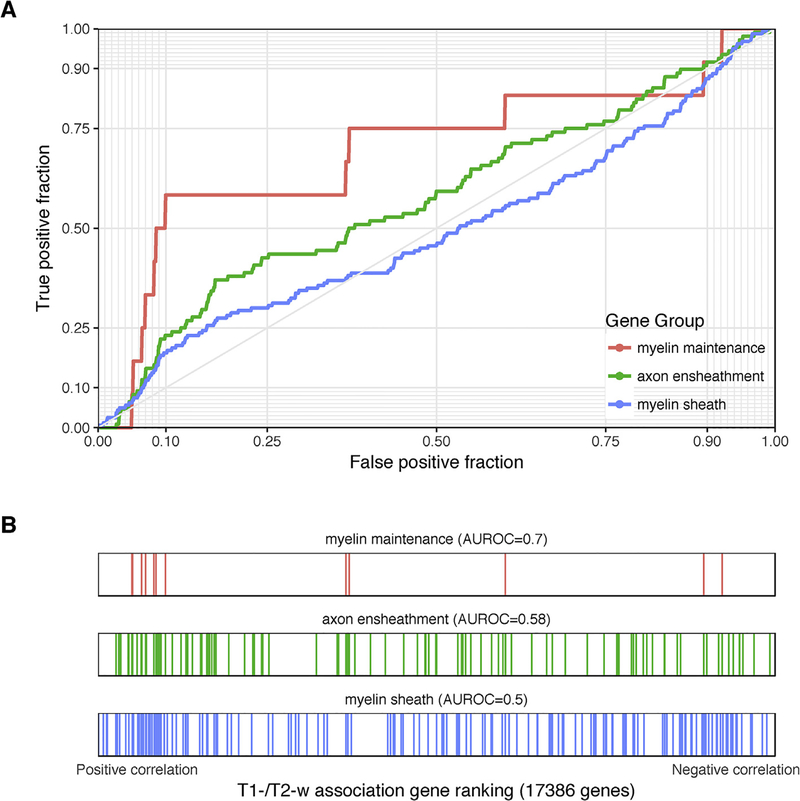
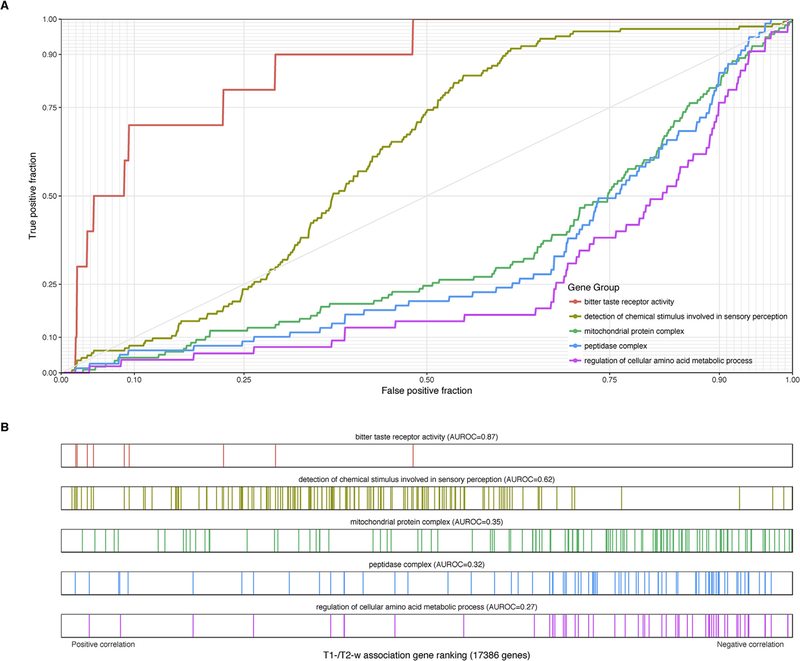
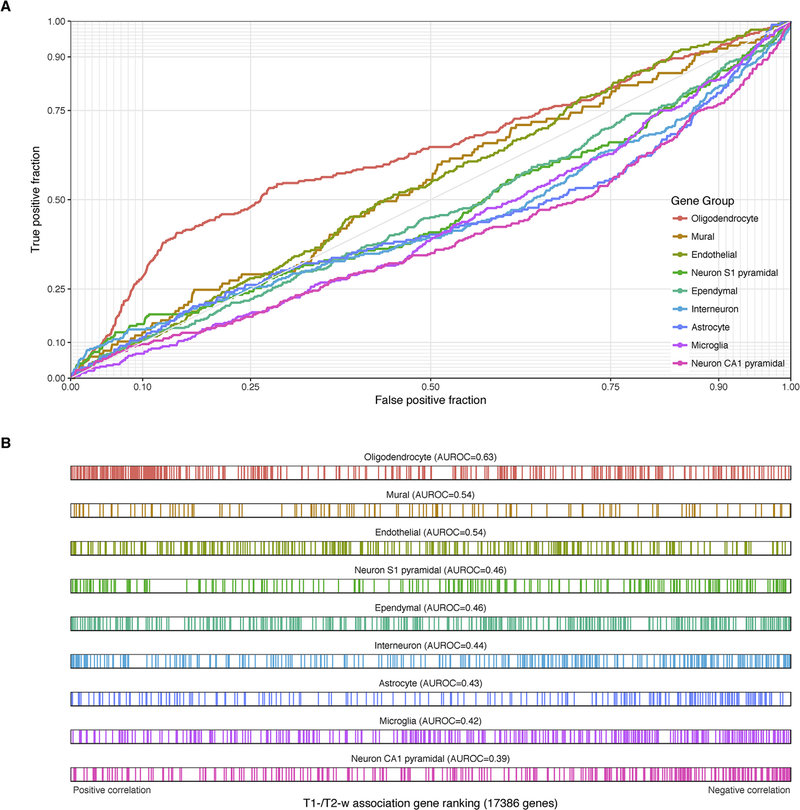
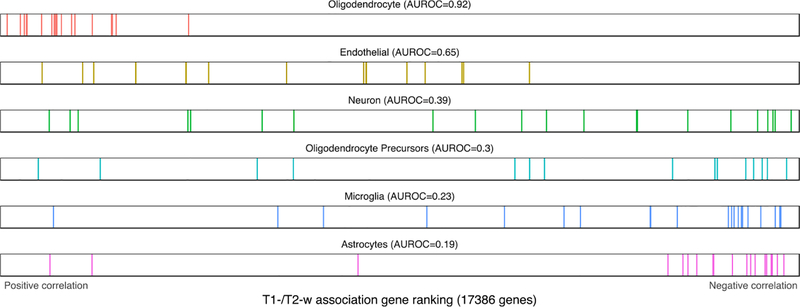
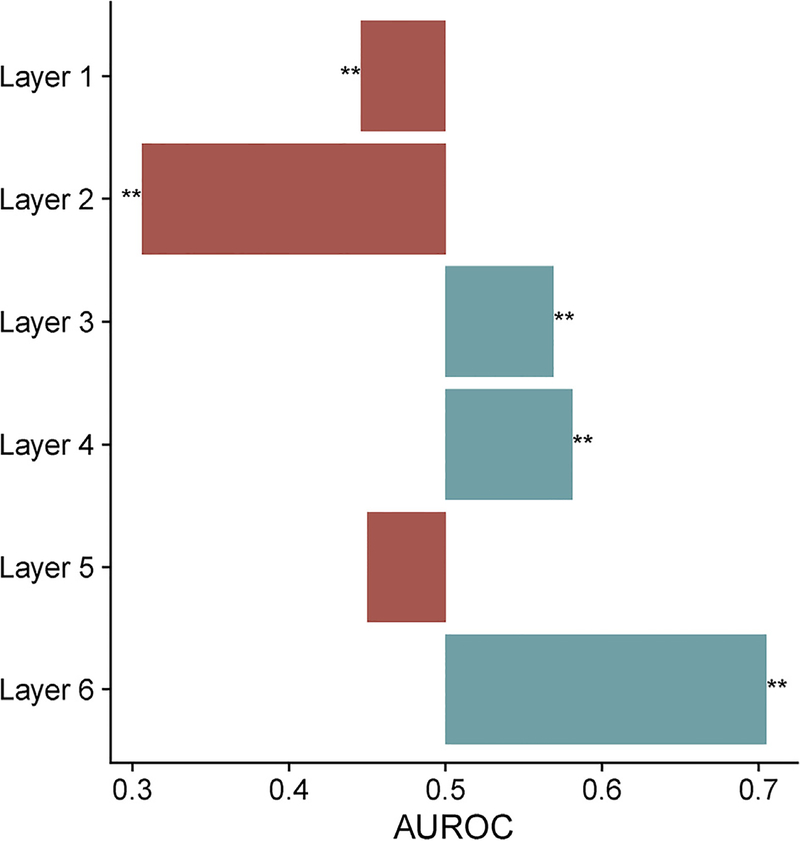
Magnetic resonance (MR) images of the brain are of immense clinical and research utility. At the atomic and subatomic levels, the sources of MR signals are well understood. However, we lack a comprehensive understanding of the macromolecular correlates of MR signal contrast. To address this gap, we used genome-wide measurements to correlate gene expression with MR signal intensity across the cerebral cortex in the Allen Human Brain Atlas (AHBA). We focused on the ratio of T1-weighted and T2-weighted intensities (T1-w/T2-w ratio image), which is considered to be a useful proxy for myelin content. As expected, we found enrichment of positive correlations between myelin-associated genes and the ratio image, supporting its use as a myelin marker. Genome-wide, there was an association with protein mass, with genes coding for heavier proteins expressed in regions with high T1-w/T2-w values. Oligodendrocyte gene markers were strongly correlated with the T1-w/T2-w ratio, but this was not driven by myelin-associated genes. Mitochondrial genes exhibit the strongest relationship, showing higher expression in regions with low T1-w/T2-w ratio. This may be due to the pH gradient in mitochondria as genes up-regulated by pH in the brain were also highly correlated with the ratio. While we corroborate associations with myelin and synaptic plasticity, differences in the T1-w/T2-w ratio across the cortex are more strongly linked to molecule size, oligodendrocyte markers, mitochondria, and pH. We evaluate correlations between AHBA transcriptomic measurements and a group averaged T1-w/T2-w ratio image, showing agreement with in-sample results. Expanding our analysis to the whole brain results in strong positive T1-w/T2-w correlations for immune system, inflammatory disease, and microglia marker genes. Genes with negative correlations were enriched for neuron markers and synaptic plasticity genes. Lastly, our findings are similar when performed on T1-w or inverted T2-w intensities alone. These results provide a molecular characterization of MR contrast that will aid interpretation of future MR studies of the brain.
Keywords: Cortex; Gene expression; Molecular neuroanatomy; Myelin map; Transcriptomics.
Copyright © 2018 The Authors. Published by Elsevier Inc. All rights reserved.
Conflict of interest statement
Competing interests statement
The authors declare no competing financial interests.
Figures
Similar articles
-
Can T1 w/T2 w ratio be used as a myelin-specific measure in subcortical structures? Comparisons between FSE-based T1 w/T2 w ratios, GRASE-based T1 w/T2 w ratios and multi-echo GRASE-based myelin water fractions.NMR Biomed. 2018 Mar;31(3). doi: 10.1002/nbm.3868. Epub 2018 Jan 9. NMR Biomed. 2018. PMID: 29315894
-
Test-retest reliability and concurrent validity of in vivo myelin content indices: Myelin water fraction and calibrated T1 w/T2 w image ratio.Hum Brain Mapp. 2017 Apr;38(4):1780-1790. doi: 10.1002/hbm.23481. Epub 2016 Dec 23. Hum Brain Mapp. 2017. PMID: 28009069 Free PMC article.
-
Whole brain myelin mapping using T1- and T2-weighted MR imaging data.Front Hum Neurosci. 2014 Sep 2;8:671. doi: 10.3389/fnhum.2014.00671. eCollection 2014. Front Hum Neurosci. 2014. PMID: 25228871 Free PMC article.
-
The role of magnetic resonance techniques in understanding and managing multiple sclerosis.Brain. 1998 Jan;121 ( Pt 1):3-24. doi: 10.1093/brain/121.1.3. Brain. 1998. PMID: 9549485 Review.
-
Magnetic resonance imaging of thymic epithelial tumors.Crit Rev Diagn Imaging. 1996 Aug;37(3):191-259. Crit Rev Diagn Imaging. 1996. PMID: 8872410 Review.
Cited by
-
Gene Expression has Distinct Associations with Brain Structure and Function in Major Depressive Disorder.Adv Sci (Weinh). 2023 Mar;10(7):e2205486. doi: 10.1002/advs.202205486. Epub 2023 Jan 13. Adv Sci (Weinh). 2023. PMID: 36638259 Free PMC article.
-
Aberrant levels of cortical myelin distinguish individuals with depressive disorders from healthy controls.Neuroimage Clin. 2021;32:102790. doi: 10.1016/j.nicl.2021.102790. Epub 2021 Aug 23. Neuroimage Clin. 2021. PMID: 34455188 Free PMC article.
-
Myelination across cortical hierarchies and depths in humans and macaques.bioRxiv [Preprint]. 2025 Feb 6:2025.02.06.636851. doi: 10.1101/2025.02.06.636851. bioRxiv. 2025. PMID: 39975294 Free PMC article. Preprint.
-
Multimodal imaging improves brain age prediction and reveals distinct abnormalities in patients with psychiatric and neurological disorders.Hum Brain Mapp. 2021 Apr 15;42(6):1714-1726. doi: 10.1002/hbm.25323. Epub 2020 Dec 19. Hum Brain Mapp. 2021. PMID: 33340180 Free PMC article.
-
Cortical morphology at birth reflects spatiotemporal patterns of gene expression in the fetal human brain.PLoS Biol. 2020 Nov 23;18(11):e3000976. doi: 10.1371/journal.pbio.3000976. eCollection 2020 Nov. PLoS Biol. 2020. PMID: 33226978 Free PMC article.
References
-
- Al-Araji A, Kidd DP, 2009. Neuro-Behçet’s disease: epidemiology, clinical characteristics, and management. Lancet Neurol. 8, 192–204. - PubMed
-
- Allen Institute for Brain Science, 2013. Technical White Paper: Microarray Survey. Available at: http://help.brain-map.org/download/attachments/2818165/WholeBrainMicroar....
-
- Benjamini Y, Hochberg Y, 1995. Controlling the false discovery rate: a practical and powerful approach to multiple testing. J. R. Stat. Soc. Ser. B Stat. Methodol 57,289–300.
Publication types
MeSH terms
Grants and funding
LinkOut - more resources
Full Text Sources
Other Literature Sources
Medical
Research Materials
Miscellaneous
