Establishment of Signaling Interactions with Cellular Resolution for Every Cell Cycle of Embryogenesis
- PMID: 29567658
- PMCID: PMC5937172
- DOI: 10.1534/genetics.118.300820
Establishment of Signaling Interactions with Cellular Resolution for Every Cell Cycle of Embryogenesis
Abstract
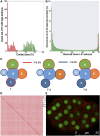
Intercellular signaling interactions play a key role in breaking fate symmetry during animal development. Identification of signaling interactions at cellular resolution is technically challenging, especially in a developing embryo. Here, we develop a platform that allows automated inference and validation of signaling interactions for every cell cycle of Caenorhabditis elegans embryogenesis. This is achieved by the generation of a systems-level cell contact map, which consists of 1114 highly confident intercellular contacts, by modeling analysis and is validated through cell membrane labeling coupled with cell lineage analysis. We apply the map to identify cell pairs between which a Notch signaling interaction takes place. By generating expression patterns for two ligands and two receptors of the Notch signaling pathway with cellular resolution using the automated expression profiling technique, we are able to refine existing and identify novel Notch interactions during C. elegans embryogenesis. Targeted cell ablation followed by cell lineage analysis demonstrates the roles of signaling interactions during cell division in breaking fate symmetry. Finally, we describe the development of a website that allows online access to the cell-cell contact map for mapping of other signaling interactions by the community. The platform can be adapted to establish cellular interactions from any other signaling pathway.
Keywords: C. elegans; Cell contact; Notch signaling; cell lineage; division asymmetry.
Copyright © 2018 by the Genetics Society of America.
Figures


Similar articles
-
Cell lineage-resolved embryonic morphological map reveals signaling associated with cell fate and size asymmetry.Nat Commun. 2025 Apr 18;16(1):3700. doi: 10.1038/s41467-025-58878-0. Nat Commun. 2025. PMID: 40251161 Free PMC article.
-
Notch signaling in the C. elegans embryo.WormBook. 2005 Jun 25:1-16. doi: 10.1895/wormbook.1.4.1. WormBook. 2005. PMID: 18050407 Free PMC article. Review.
-
Reciprocal signaling by Wnt and Notch specifies a muscle precursor in the C. elegans embryo.Development. 2017 Feb 1;144(3):419-429. doi: 10.1242/dev.145391. Epub 2017 Jan 3. Development. 2017. PMID: 28049659 Free PMC article.
-
Notch signaling is antagonized by SAO-1, a novel GYF-domain protein that interacts with the E3 ubiquitin ligase SEL-10 in Caenorhabditis elegans.Genetics. 2012 Mar;190(3):1043-57. doi: 10.1534/genetics.111.136804. Epub 2011 Dec 29. Genetics. 2012. PMID: 22209900 Free PMC article.
-
Do as I say, Not(ch) as I do: Lateral control of cell fate.Dev Biol. 2019 Mar 1;447(1):58-70. doi: 10.1016/j.ydbio.2017.09.032. Epub 2017 Sep 29. Dev Biol. 2019. PMID: 28969930 Review.
Cited by
-
Cell lineage-resolved embryonic morphological map reveals signaling associated with cell fate and size asymmetry.Nat Commun. 2025 Apr 18;16(1):3700. doi: 10.1038/s41467-025-58878-0. Nat Commun. 2025. PMID: 40251161 Free PMC article.
-
Delineating the mechanisms and design principles of Caenorhabditis elegans embryogenesis using in toto high-resolution imaging data and computational modeling.Comput Struct Biotechnol J. 2022 Aug 19;20:5500-5515. doi: 10.1016/j.csbj.2022.08.024. eCollection 2022. Comput Struct Biotechnol J. 2022. PMID: 36284714 Free PMC article. Review.
-
Initial characterization of gap phase introduction in every cell cycle of C. elegans embryogenesis.Front Cell Dev Biol. 2022 Oct 25;10:978962. doi: 10.3389/fcell.2022.978962. eCollection 2022. Front Cell Dev Biol. 2022. PMID: 36393848 Free PMC article.
-
Genomic architecture of 5S rDNA cluster and its variations within and between species.BMC Genomics. 2022 Mar 27;23(1):238. doi: 10.1186/s12864-022-08476-x. BMC Genomics. 2022. PMID: 35346033 Free PMC article.
-
Establishment of a morphological atlas of the Caenorhabditis elegans embryo using deep-learning-based 4D segmentation.Nat Commun. 2020 Dec 7;11(1):6254. doi: 10.1038/s41467-020-19863-x. Nat Commun. 2020. PMID: 33288755 Free PMC article.
References
-
- Aurenhammer F., 1991. Voronoi diagrams–a survey of a fundamental geometric data structure. ACM Comput. Surv. 23: 345–405. 10.1145/116873.116880 - DOI
-
- Bowerman B., Tax F. E., Thomas J. H., Priess J. R., 1992. Cell interactions involved in development of the bilaterally symmetrical intestinal valve cells during embryogenesis in Caenorhabditis elegans. Development 116: 1113–1122. - PubMed
Publication types
MeSH terms
Substances
Grants and funding
LinkOut - more resources
Full Text Sources
Other Literature Sources
Molecular Biology Databases

