

doi: 10.3324/haematol.2018.190926.
Epub 2018 Mar 22.
Automated decision tree to evaluate genetic abnormalities when determining prognostic risk in acute myeloid leukemia
Affiliations
- PMID: 29567769
- PMCID: PMC6068037
- DOI: 10.3324/haematol.2018.190926
Item in Clipboard
Automated decision tree to evaluate genetic abnormalities when determining prognostic risk in acute myeloid leukemia
Haematologica.
2018 Aug.
No abstract available
Figures

Experimental design to determine the impact of genetic mutation co-occurrence on prognostic risk in acute myeloid leukemia (AML). Patient information from three AML datasets were combined and mutation status and karyotype were extracted. These records were analyzed using an automated script that classified each patient based on their European LeukemiaNet (ELN) prognostic risk score, and the prognostic impact of each genetic test was evaluated. *“Other abnormalities” is defined as the presence of one or two abnormalities. **“Complex karyotype” is defined as the presence of three or more abnormalities.
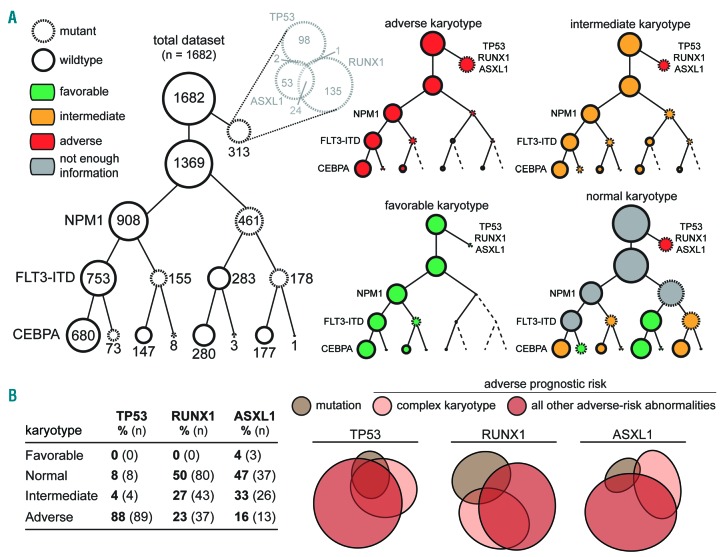
Mutational co-occurrence within cytogenetic prognostic risk categories in 1682 acute myeloid leukemia patients. Patients were grouped into four categories according to their karyotype: Adverse, Intermediate, or Favorable (which contain abnormalities that categorize them accordingly, based on the 2017 European LeukemiaNet guidelines); and Normal (which contains no abnormalities). (A) Patients were categorized as having TP53, RUNX1, or ASXL1 mutations, and, for the remaining patients, subdivided by sequential presence or absence of NPM1 mutations, FLT3-ITD, and CEBPA mutations. The area of each circle is proportional to the number of patients within that category. (B) The frequency of TP53, RUNX1, and ASXL1 was tabulated across different karyotype risk categories. Proportional Venn diagrams were drawn showing the overlap between the presence of complex karyotype, an adverse risk gene mutation, and all other adverse cytogenetic abnormalities.

Automated decision tree determines that genetic abnormalities have different prognostic significance individually and sequentially in acute myeloid leukemia patients. (A) Overview of automated decision tree to determine acute myeloid leukemia prognostic risk. After automatically identifying the prognostically significant karyotypic abnormalities, the decision tree returns the assigned prognostic risk category based on the hierarchy of abnormalities described in the European LeukemiaNet (ELN) guidelines (see Online Supplementary Methods). (B) Prognostic impact of individual genetic abnormalities, as measured by the omission of data from each of the seven prognostically significant genetic test and the assignment of patients into prognostic risk categories. k: karyotype; f: FLT3-ITD; n: NPM1; c: CEBPA; p: TP53; r: RUNX1; a: ASXL1. (C) Sequential analysis of every possible arrangement of the genetic tests to best determine overall prognostic risk. To mimic an unknown test result, each patient was considered to be wild type for gene mutations and have normal karyotype. For each test in a particular sequence, the prognostic risk category was calculated after successively adding in the test results, and the percentage of patients with a correctly called prognostic risk was recorded. Every possible test sequence (5040 total) was graphed and the optimized sequence to identify patients with favorable (green), intermediate (yellow and dark yellow), and adverse (red) risk were labeled. For all three categories, the optimized sequence began with karyotype, which is labeled in black. (D–F) The sequential analysis for all possible arrangement of tests to best identify patients with (D) favorable, (E) intermediate, and (F) adverse prognostic risk. For these sequences, the percentage of correctly called prognostic risk patients was normalized due to the differences in population size across categories.
Similar articles
-
Cytogenetic heterogeneity negatively impacts outcomes in patients with acute myeloid leukemia.Haematologica. 2015 Mar;100(3):331-5. doi: 10.3324/haematol.2014.117267. Epub 2014 Dec 19. Haematologica. 2015. PMID: 25527568 Free PMC article.
-
Chromosome abnormalities at onset of complete remission are associated with worse outcome in patients with acute myeloid leukemia and an abnormal karyotype at diagnosis: CALGB 8461 (Alliance).Haematologica. 2016 Dec;101(12):1516-1523. doi: 10.3324/haematol.2016.149542. Epub 2016 Jul 28. Haematologica. 2016. PMID: 27470602 Free PMC article.
-
Association of the type of 5q loss with complex karyotype, clonal evolution, TP53 mutation status, and prognosis in acute myeloid leukemia and myelodysplastic syndrome.Genes Chromosomes Cancer. 2014 May;53(5):402-10. doi: 10.1002/gcc.22151. Epub 2014 Feb 3. Genes Chromosomes Cancer. 2014. PMID: 24493299
-
Innovative strategies for adverse karyotype acute myeloid leukemia.Curr Opin Hematol. 2017 Mar;24(2):89-98. doi: 10.1097/MOH.0000000000000318. Curr Opin Hematol. 2017. PMID: 28099271 Review.
-
Progress in acute myeloid leukemia.Clin Lymphoma Myeloma Leuk. 2015 Mar;15(3):139-51. doi: 10.1016/j.clml.2014.08.006. Epub 2014 Sep 19. Clin Lymphoma Myeloma Leuk. 2015. PMID: 25441110 Free PMC article. Review.
References
-
- Kihara R, Nagata Y, Kiyoi H, et al. Comprehensive analysis of genetic alterations and their prognostic impacts in adult acute myeloid leukemia patients. Leukemia. 2014;28(8):1586–1595. - PubMed
-
- Döhner H, Estey EH, Amadori S, et al. Diagnosis and management of acute myeloid leukemia in adults: recommendations from an international expert panel, on behalf of the European LeukemiaNet. Blood. 2010;115(3):453–474. - PubMed
Publication types
MeSH terms
Grants and funding
LinkOut - more resources
Full Text Sources
Other Literature Sources
Medical
