

doi: 10.3324/haematol.2018.191338.
Epub 2018 Mar 22.
GATA1 s exerts developmental stage-specific effects in human hematopoiesis
Affiliations
- PMID: 29567780
- PMCID: PMC6068023
- DOI: 10.3324/haematol.2018.191338
Item in Clipboard
GATA1 s exerts developmental stage-specific effects in human hematopoiesis
Haematologica.
2018 Aug.
No abstract available
Figures
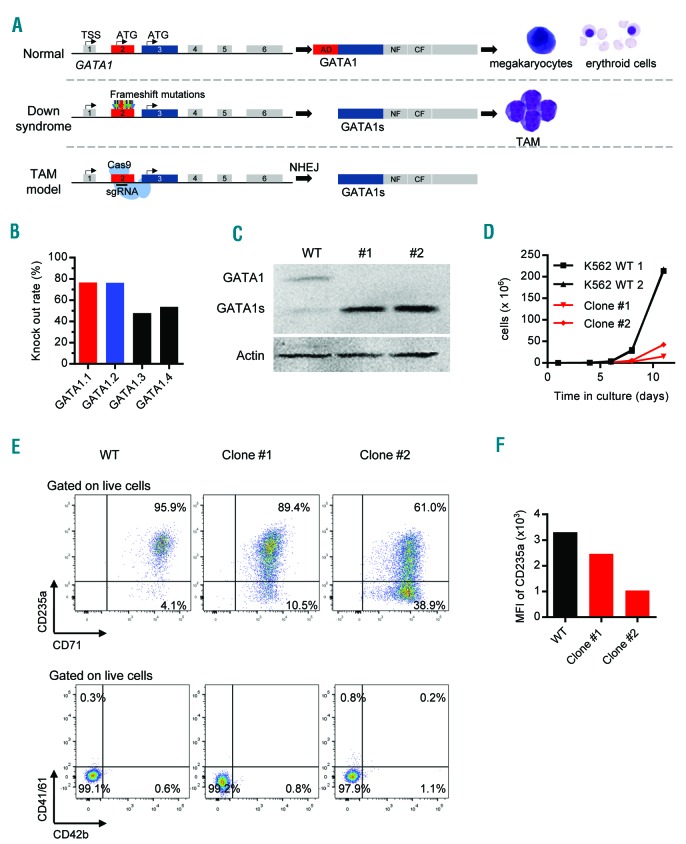
GATA1s mutation is essential for the development of transient abnormal myelopoiesis (TAM). (A) Schematic representation of the GATA1 locus, the translation of wild-type (WT) GATA1 product in normal fetal hematopoiesis (top), and the translation of GATA1s after the introduction of mutations as seen in TAM (middle) or as generated using CRISPR-Cas9 genome editing (bottom). (B) The efficacies of 4 different sgRNAs targeting exon 2 of GATA1 as assessed using a fluorescence-based reporter assay. The sgRNAs selected for later studies are marked red and blue. (C-F) K562 cells lentivirally transduced with GATA1-targeting (GATA1.1 and GATA1.2) or control (Luc.1) sgRNAs. (C) Western blot of GATA1 and GATA1s proteins in WT K562 cells and in two representative GATA1s-K562 clones (#1 and #2; used in subsequent experiments). (D) Number of WT and GATA1s-K562 cells (clone #1 and #2) grown in liquid culture. (E) Flow cytometric analysis of WT and GATA1s-K562 cells (clone #1 and #2) for expression of the indicated cell surface markers. (F) Expression of CD235a represented as mean fluorescence intensity (MFI), in WT K562 cells and GATA1s-K562 clone #1 and #2.
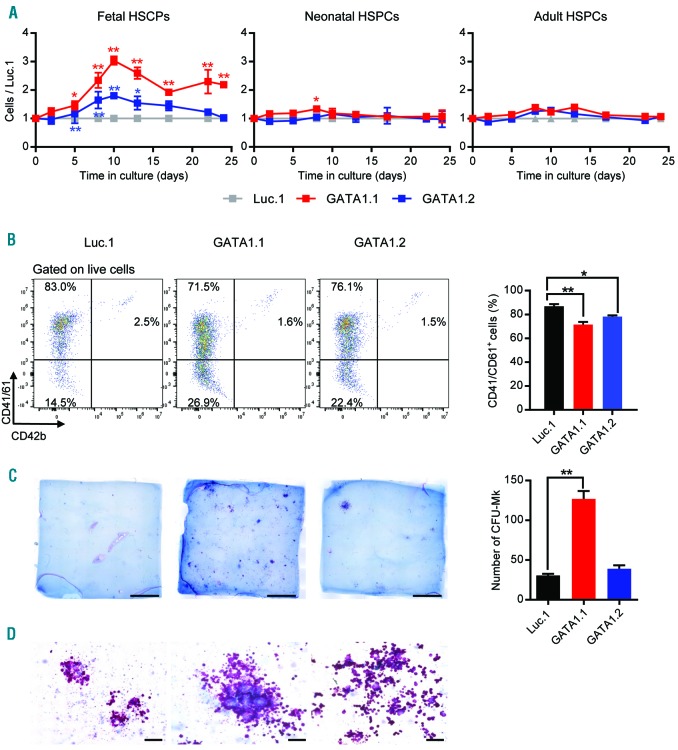
GATA1s mutations in fetal hematopoietic stem and progenitor cells (HSPCs) promote the hyperproliferation of megakaryocytic progenitors. Fetal, neonatal and adult HSPCs were transduced with GATA1-targeting (GATA1.1 and GATA1.2) or control (Luc.1) sgRNAs. (A) Relative number of transduced HSPCs (normalized to the number of Luc.1 cells) grown in liquid cultures supporting megakaryocytic differentiation. Data from 1 of 4 independent experiments performed in replicates are shown as mean±Standard Deviation (SD). *PANOVA<0.05, **PANOVA<0.01. (B) (Left) Representative flow cytometry plots (from 3 independent experiments), showing expression of the common megakaryocytic markers CD41/CD61 and CD42b in fetal HSPCs (pre-gated on live cells). Percentages of each population are indicated. (Right) Percentage of fetal CD41/CD61+ cells on day 10 of megakaryocytic differentiation. Data from 2 independent experiments performed in replicates are shown as mean±SD. *PANOVA<0.05, **PANOVA<0.01. (C) (Left) Photographs (scale bar 5 mm) of CFU-MK assays using lentivirally transduced fetal HSPCs. (Right) Number of CFU-MKs. **PANOVA<0.01. (D) Microscopic images of CFU-MK assays (400× original magnification; scale bar 100 μm).
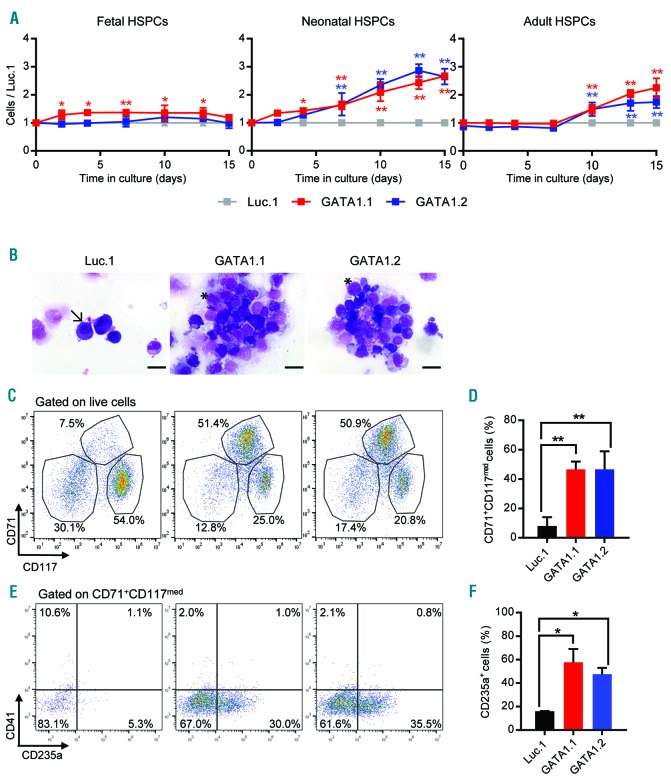
GATA1s perturbs megakaryocytic/erythroid differentiation of neonatal hematopoietic stem and progenitor cells (HSPCs), resulting in accumulation of erythroid progenitors. Fetal, neonatal and adult HSPCs were transduced with GATA1-targeting (GATA1.1 and GATA1.2) or control (Luc.1) sgRNAs. (A) Relative number of transduced HSPCs (normalized to the number of Luc.1 cells) grown in liquid cultures supporting combined megakaryocytic/erythroid differentiation. Data from 1 of 4 independent experiments performed in replicates are shown as mean±Standard Deviation (SD). *PANOVA<0.05, **PANOVA<0.01. (B) Microscopic images (MGG staining; 1000x original magnification; scale bar 20 μm) of sorted neonatal CD34+ HSPCs on day 10 of combined megakaryocytic/erythroid differentiation. A representative mature erythroid cell is indicated by an arrow (left photograph), while characteristic immature erythroblast-like cells are indicated by an asterisk (middle and right photographs). (C) Representative flow cytometry plots (from 3 independent experiments), showing CD71+CD117−, CD71+CD117med and CD71+CD117+ neonatal HSPC-derived cells on day 10 of combined megakaryocytic/erythroid differentiation (pre-gated on live cells). Percentages of each population are indicated. (D) Percentage of neonatal CD71+CD117med cells on day 10 of combined megakaryocytic/erythroid differentiation. Data from 3 independent experiments are shown as mean±SD. **PANOVA<0.01. (E) Representative flow cytometry plots (from 2 independent experiments), depicting the CD41−CD235a− and CD41−CD235a+ cells within the neonatal CD71+CD117med population. Percentages of each population are indicated. (F) Percentage of the CD41−CD235a+ population. Data from replicates of 2 independent experiments are shown as mean±SD. *PANOVA<0.05.
References
-
- Wechsler J, Greene M, McDevitt MA, et al. Acquired mutations in GATA1 in the megakaryoblastic leukemia of Down syndrome. Nat Genet. 2002;32(1):148–152. - PubMed
-
- Alford KA, Reinhardt K, Garnett C, et al. Analysis of GATA1 mutations in Down syndrome transient myeloproliferative disorder and myeloid leukemia. Blood. 2011;118(8):2222–2238. - PubMed
Publication types
MeSH terms
Substances
LinkOut - more resources
Full Text Sources
Other Literature Sources
Research Materials
