

Human ALPI deficiency causes inflammatory bowel disease and highlights a key mechanism of gut homeostasis
- PMID: 29567797
- PMCID: PMC5887907
- DOI: 10.15252/emmm.201708483
Human ALPI deficiency causes inflammatory bowel disease and highlights a key mechanism of gut homeostasis
Abstract
Herein, we report the first identification of biallelic-inherited mutations in ALPI as a Mendelian cause of inflammatory bowel disease in two unrelated patients. ALPI encodes for intestinal phosphatase alkaline, a brush border metalloenzyme that hydrolyses phosphate from the lipid A moiety of lipopolysaccharides and thereby drastically reduces Toll-like receptor 4 agonist activity. Prediction tools and structural modelling indicate that all mutations affect critical residues or inter-subunit interactions, and heterologous expression in HEK293T cells demonstrated that all ALPI mutations were loss of function. ALPI mutations impaired either stability or catalytic activity of ALPI and rendered it unable to detoxify lipopolysaccharide-dependent signalling. Furthermore, ALPI expression was reduced in patients' biopsies, and ALPI activity was undetectable in ALPI-deficient patient's stool. Our findings highlight the crucial role of ALPI in regulating host-microbiota interactions and restraining host inflammatory responses. These results indicate that ALPI mutations should be included in screening for monogenic causes of inflammatory bowel diseases and lay the groundwork for ALPI-based treatments in intestinal inflammatory disorders.
Keywords: inflammatory bowel diseases; intestinal phosphatase alkaline; monogenic disease.
© 2018 The Authors. Published under the terms of the CC BY 4.0 license.
Figures
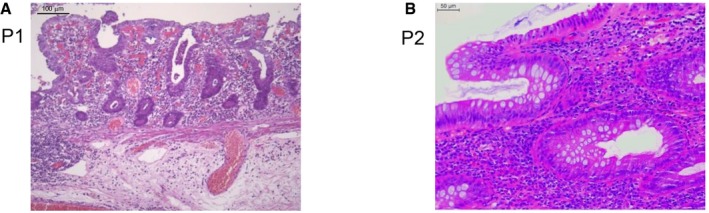
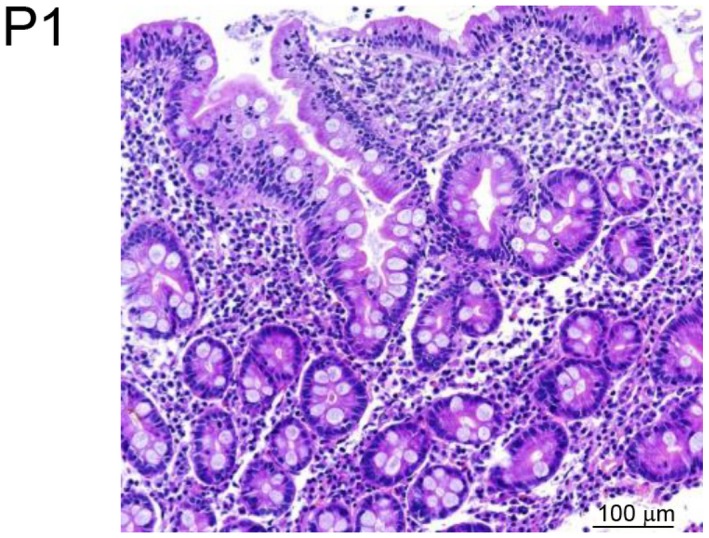
- A, B
Haematoxylin–eosin staining of colonic biopsies from P1 (A) and P2 (B). Scale bars: 100 μm (A) and 50 μm (B).
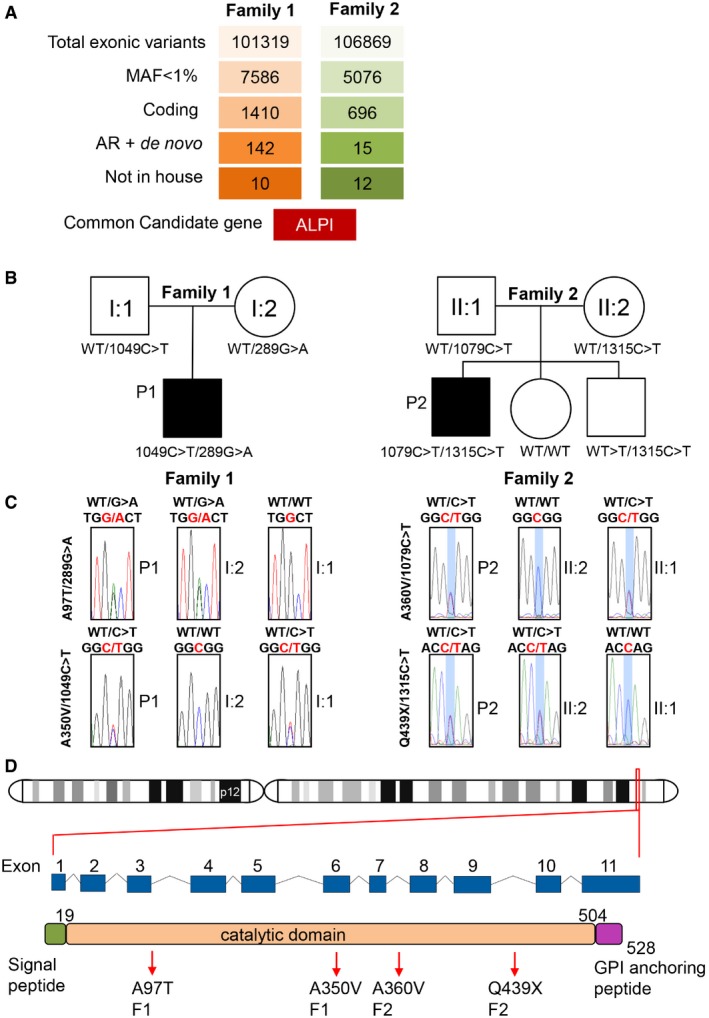
Variant identification pipeline for WES in P1 and P2 (see also Appendix Tables S1 and S2).
Unrelated familial trees showing affected children in black and healthy individuals in white.
Sanger sequencing of the region corresponding to mutations in ALPI in both families.
Location of ALPI on chromosome 2 and diagrams featuring ALPI gene with its nine exons and ALPI protein with its N‐terminal signal peptide, phosphatase domain and C‐terminal recognition signal for the transamidase complex (GPI‐anchor attachment site), which removes the GPI signal sequence and replaces it by a preformed GPI precursor glycolipid. Arrows point to mutations identified in P1 and P2. Numbers indicate amino acid position.
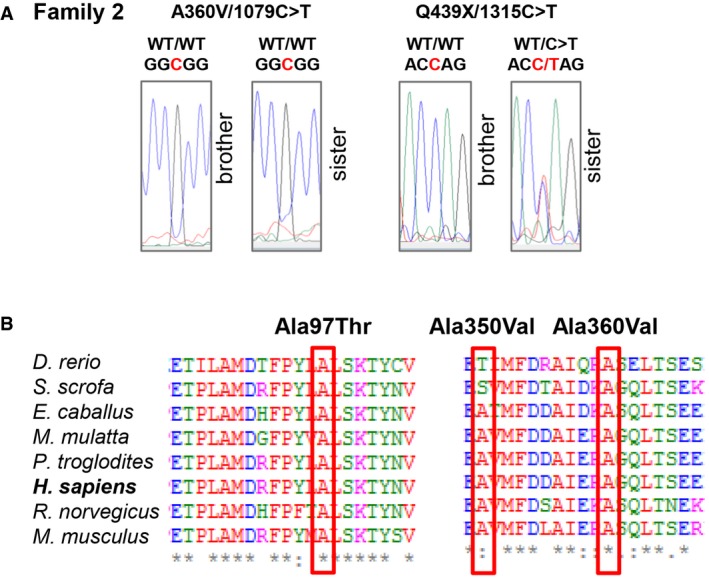
Confirmatory Sanger sequencing for siblings in Family 2.
Multiple alignments of ALPI orthologs from different species using the Clustal Omega software. Residues altered by mutations in P1 and P2 are boxed in red. Conserved residues are indicated as follow: full identity (*), similar characteristics (:) (> 0.5 in the Gonnet PAM 250 matrix), weak similarities (.) (< 0.5 in the Gonnet PAM 250 matrix).
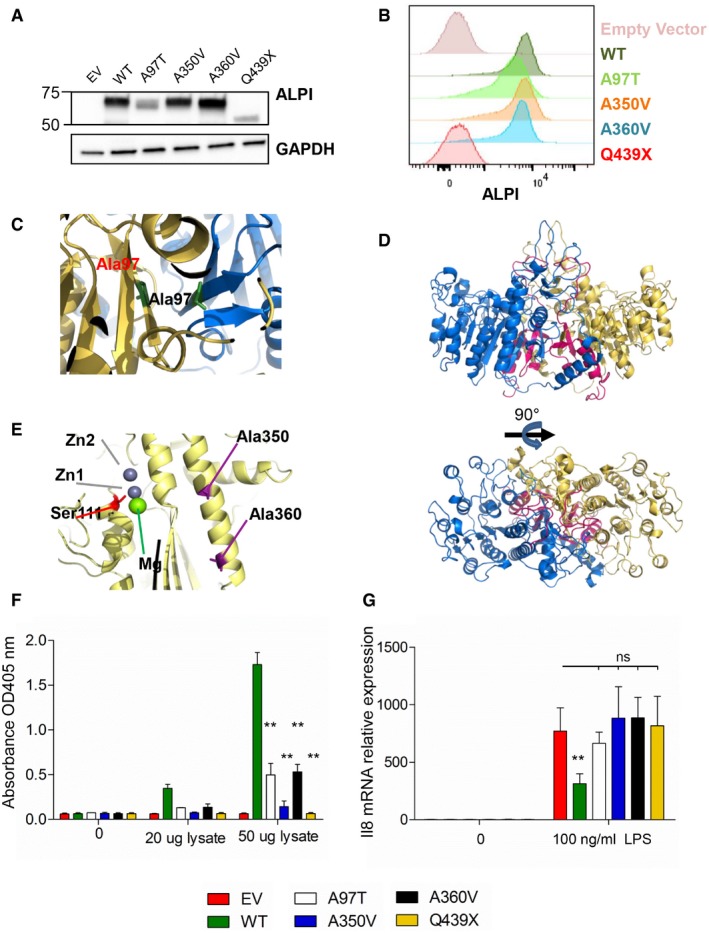
- A, B
Analysis with ALPI antibody of HEK293T cells (lacking endogenous ALPI expression) after mock transduction or transduction with lentiviral particles encoding indicated mutants. (A) Western blot of whole‐cell lysates. (B) Flow cytometry analysis of surface‐labelled cells.
- C–E
3D modelling of ALPI calculated on the basis of the crystal structure of ALPP. ALPI is represented with one monomer in yellow, and the second in blue. Alanine 350, alanine 360 and catalytic Ser111 are represented in stick in violet, cyan and red, respectively. Deletion of the C‐terminal from Gln439 is shown in pink. Top and bottom views shown in (D) correspond to a 90° rotation.
- F
pNPP phosphatase activity of WT and ALPI mutants measured by the OD405 nm of the reaction supernatants. n = 5, error bars indicate SD. **P = 0.0079, nonparametric, unpaired two‐tailed Mann–Whitney test.
- G
IL‐8 inhibition of LPS‐induced transcription in THP1 cells by WT and ALPI mutants. GAPDH, glyceraldehyde‐3‐phosphate dehydrogenase; EV, empty vector. n = 3, error bars indicate SD. **P = 0.022, nonparametric, unpaired two‐tailed Mann–Whitney test.
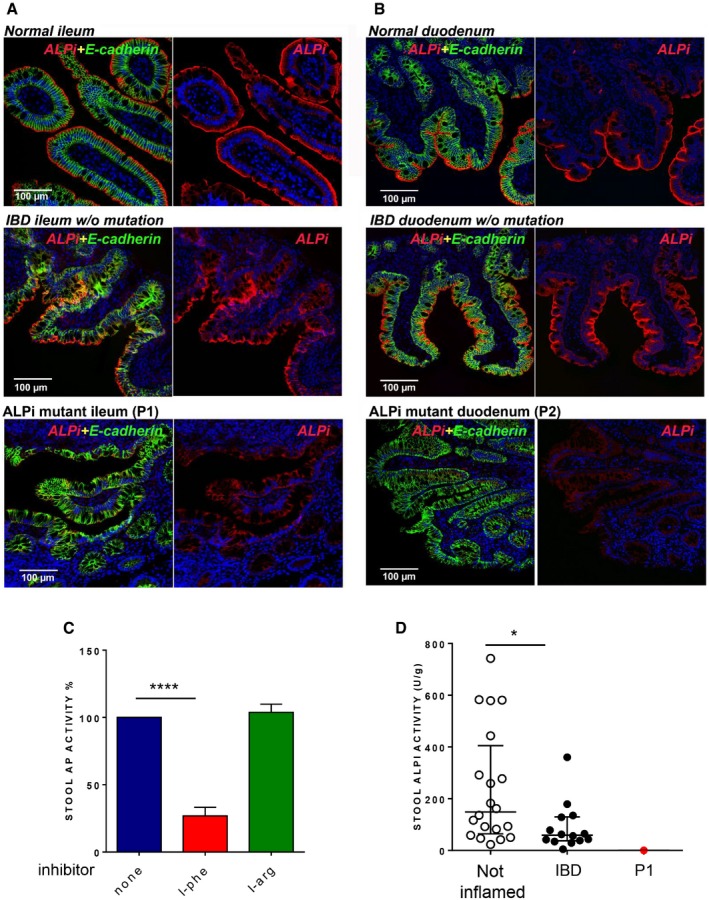
- A, B
Immunofluorescence microscopy of duodenum (A) and ileum (B) sections from Patient 1 (A) and Patient 2 (B) compared to normal or IBD controls. Sections were stained with DAPI (4′,6‐diamidino‐2‐phenylindole) for DNA (blue) and antibodies against ALPI alone (second column, red) or ALPI and E‐cadherin (green) (first column, merge staining). Magnification 20× (scale bar = 100 μm).
- C
Effect of AP inhibitors (L‐phe, L‐arg) on AP activity in stools of non‐inflamed controls (n = 20). Data are expressed as mean ± SD. ****P < 0.0001, nonparametric, unpaired two‐tailed Mann–Whitney test.
- D
ALPI activity in stools of non‐inflamed (n = 20) or IBD controls (n = 14) and of P1. AP values are expressed as units of ALPI/g stool and as medians with interquartiles; *P = 0.0122, nonparametric, unpaired two‐tailed Mann–Whitney test.
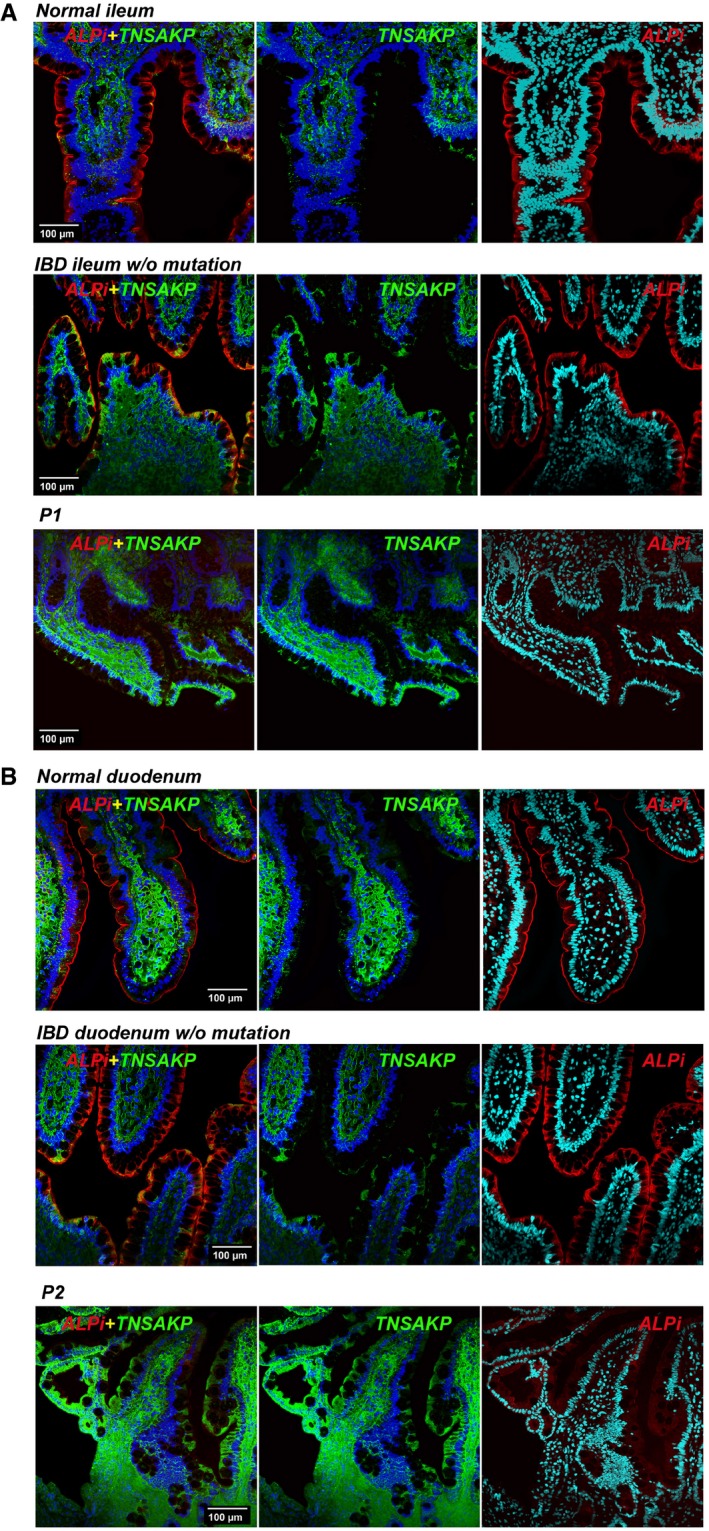
- A, B
Immunofluorescence microscopy of duodenum (A) and ileum (B) sections from P1 (A) and P2 (B) compared with normal or IBD controls. Sections were counterstained with blue RedDot2 dye for DNA and antibodies against ALPI alone (red), TNAP alone (green) or TNAP and ALPI (first column, merge staining). Magnification 20× (Scale bars: 100 μm).
References
-
- Astiz ME, Rackow EC, Still JG, Howell ST, Cato A, Von Eschen KB, Ulrich JT, Rudbach JA, McMahon G, Vargas R et al (1995) Pretreatment of normal humans with monophosphoryl lipid A induces tolerance to endotoxin: a prospective, double‐blind, randomized, controlled trial. Crit Care Med 23: 9–17 - PubMed
