. 2018 May 24;131(21):2345-2356.
doi: 10.1182/blood-2017-10-809210. Epub 2018 Mar 22.

Pan-SRC kinase inhibition blocks B-cell receptor oncogenic signaling in non-Hodgkin lymphoma

Affiliations

Pan-SRC kinase inhibition blocks B-cell receptor oncogenic signaling in non-Hodgkin lymphoma

Elena Battistello et al. Blood. .

Abstract

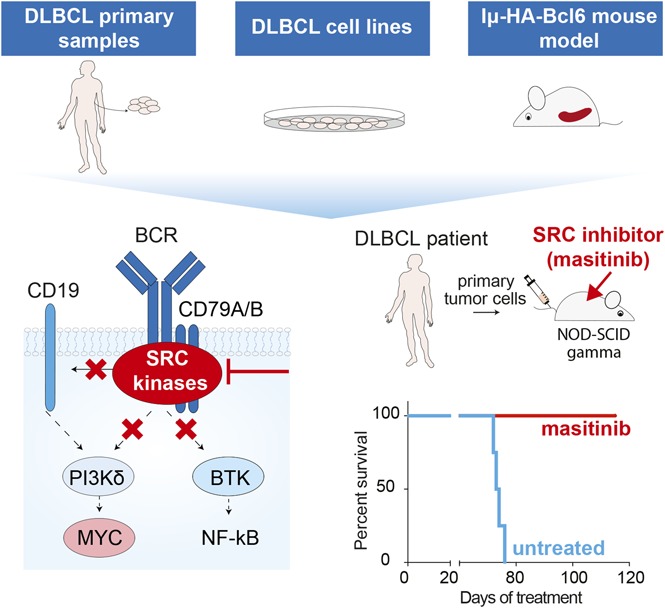
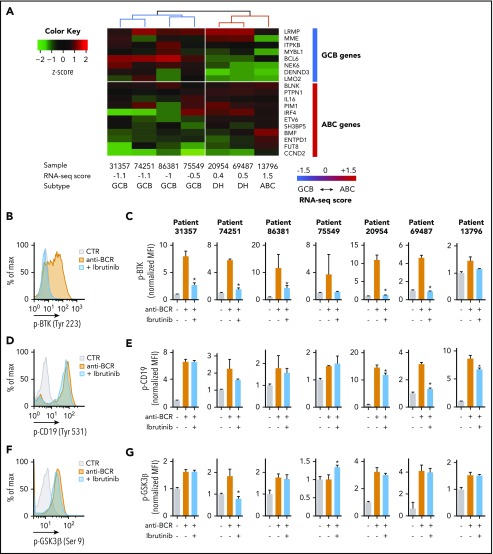
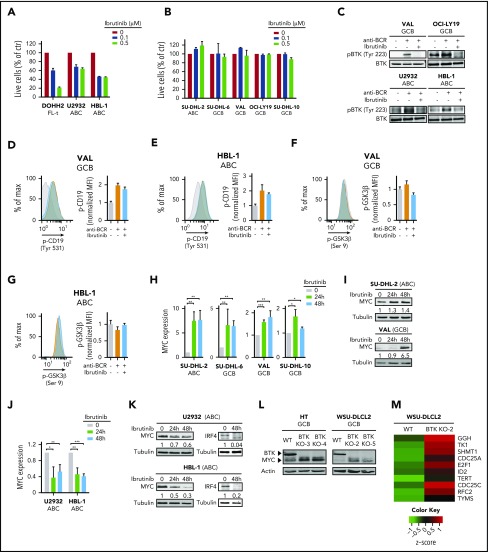
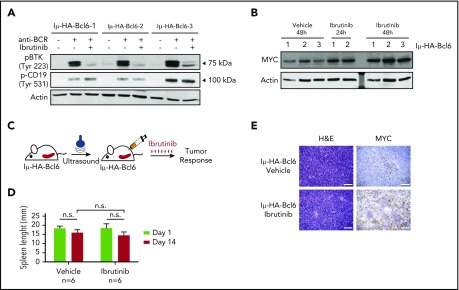
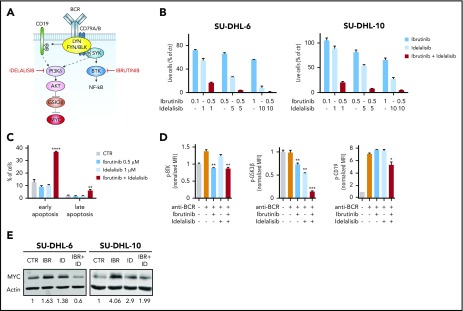
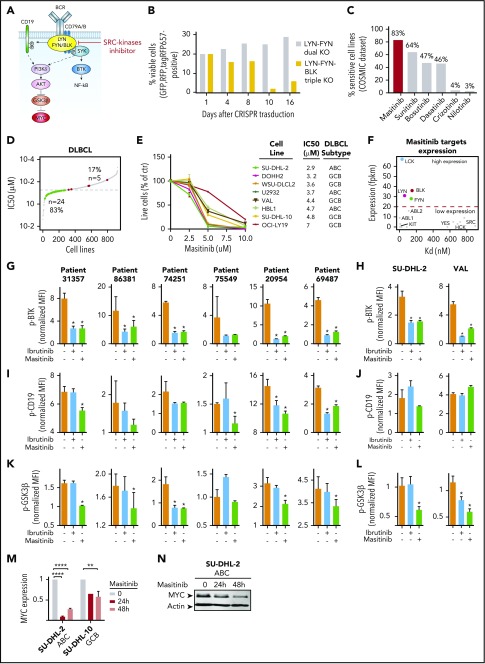
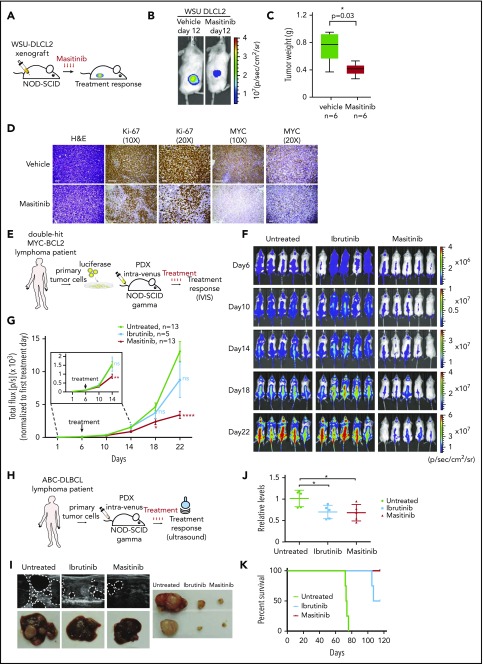
In diffuse large B-cell lymphoma (DLBCL), activation of the B-cell receptor (BCR) promotes multiple oncogenic signals, which are essential for tumor proliferation. Inhibition of the Bruton's tyrosine kinase (BTK), a BCR downstream target, is therapeutically effective only in a subgroup of patients with DLBCL. Here, we used lymphoma cells isolated from patients with DLBCL to measure the effects of targeted therapies on BCR signaling and to anticipate response. In lymphomas resistant to BTK inhibition, we show that blocking BTK activity enhanced tumor dependencies from alternative oncogenic signals downstream of the BCR, converging on MYC upregulation. To completely ablate the activity of the BCR, we genetically and pharmacologically repressed the activity of the SRC kinases LYN, FYN, and BLK, which are responsible for the propagation of the BCR signal. Inhibition of these kinases strongly reduced tumor growth in xenografts and cell lines derived from patients with DLBCL independent of their molecular subtype, advancing the possibility to be relevant therapeutic targets in broad and diverse groups of DLBCL patients.


Conflict of interest statement

Conflict-of-interest disclosure: The authors declare no competing financial interests.

Figures

None
Graphical abstract
Figure 1.
Figure 1.
Analysis of BCR signaling in primary DLBCL patient samples. (A) Classification of 7 DLBCL primary samples based on their expression profile. The heat map shows the expression (z-score) of 8 GCB and 11 ABC genes in the indicated samples. The computed RNA-seq score distinguishes between GCB, ABC DLBCL, or DH. (B,D,F) Representative flow cytometry analysis to determine the phosphorylation of BTK (B, patient 69487), CD19 (D, patient 20954), and GSK3β (F, patient 20954) in purified lymphoma cells stimulated with anti-BCR (orange) or treated with ibrutinib (blue). Unstimulated cells were used as control (gray). (C,E,G) Quantification of the median fluorescence values (MFIs) of pBTK (Tyr223) (C), pCD19 (Tyr 531) (E), and pGSK3β (Ser9) (G) in the indicated patients normalized to the stained, unstimulated control. Data are represented as bar plots corresponding to the mean ± standard deviation (SD) of 3 replicates. Significant changes between stimulated cells (orange bars) and stimulated cells treated with ibrutinib (blue bars) are labeled with an asterisk (uncorrected P ≤ .05). Unlabeled bars indicate not statistically significant changes.
Figure 2.
Figure 2.
Treatment with ibrutinib changes MYC expression in cells sensitive and resistant to ibrutinib. (A-B) Percentage of viable cells in the indicated lymphoma cell lines treated with DMSO or 0.1 or 0.5 μM ibrutinib for 72 hours. Each cell line was analyzed in triplicate, and data are shown as a bar graph corresponding to the mean ± SD. (C) Western blot analysis of pBTK levels in GCB and ABC cells after DMSO or ibrutinib treatment (0.5 μM, 6 hours) and BCR stimulation (20 μg/mL F[ab']2 anti-human immunoglobulin M, 3 min). (D-G) Phosphoflow cytometry analysis and quantification of CD19 (Tyr 531) (D-E) and GSK3β (Ser 9) (F-G) in stimulated lymphoma cells pretreated with DMSO or ibrutinib (0.5 μM) for 6 hours, normalized to the stained, unstimulated controls. (H) MYC expression in the indicated ibrutinib-resistant cell lines treated with DMSO or ibrutinib (0.5 μM) for 24 or 48 hours. Each cell line was analyzed in 3 biological replicates. Data have been normalized to the DMSO-treated control and are shown as a bar graph corresponding to the mean ± SD. P values were calculated using 2-tailed Student t test. Significant changes between DMSO-treated and ibrutinib-treated cells were labeled with *P ≤ .05; **P ≤ .01; ***P ≤ .001. (I) Western blot analysis of the indicated ibrutinib-resistant cell lines treated with DMSO or ibrutinib (0.5 μM) for 24 or 48 hours. Signal quantification was performed using Image Studio Lite and normalized to the DMSO-treated control. (J) MYC expression in the indicated ibrutinib-sensitive cell lines treated with DMSO or ibrutinib (0.5 μM) for 24 or 48 hours. Each cell line was analyzed in 3 biological replicates. Data have been normalized to the DMSO-treated control and are shown as a bar graph corresponding to the mean ± SD. P values were calculated using 2-tailed Student t test. Significant changes between DMSO-treated and ibrutinib-treated cells were labeled with *P ≤ .05; **P ≤ .01; ***P ≤ .001. (K) Western blot analysis of the indicated ibrutinib-sensitive cell lines treated with DMSO or ibrutinib (0.5 μM) for 24 or 48 hours. Signal quantification was performed using Image Studio Lite and normalized to the DMSO-treated control. (L) Western blot analysis of MYC and BTK in isogenic GCB cell lines WT or BTK KO. (M) Heat map indicating the expression levels (z-scores) of 10 MYC target genes in WSU-DLCL2 cells WT or BTK KO.
Figure 3.
Figure 3.
MYC is upregulated in IμHABCL6 animals harboring ibrutinib-resistant DLBCL. (A) Western blot analysis of pBTK (Tyr223) and pCD19 (Tyr531) in purified murine B-cells pretreated with DMSO or ibrutinib (0.5 μM) for 6 hours and stimulated with H2O2 for 3 minutes. (B) Western blot analysis of MYC levels in purified tumor B cells from 18- to 20-month-old IμHABCL6 mice. Cells isolated from each animal were divided in 3 aliquots and kept in culture in the presence of DMSO or ibrutinib (0.5 μM) for 24 or 48 hours. (C) Pipeline for ibrutinib treatment in IμHABCL6 mice. Spleen size was assessed by ultrasound in 13- to 21-month-old mice. Mice enrolled in the study were treated with ibrutinib (12 mg/kg per day IP) for 14 days. (D) Spleen length in IμHABCL6 mice measured by ultrasound at day 1 and 14 in animals treated with ibrutinib or vehicle. Data are shown as a bar graph corresponding to the mean of 6 mice ± SD. P values were calculated using 2-tailed Student t test. (E) Representative images of immunohistochemistry analyses of IμHABCL6 mice spleen tissues. Scale bars, 100 μm. H&E, hematoxylin and eosin; n.s., not statistically significant.
Figure 4.
Figure 4.
Synergism between BTK and PI3Kδ inhibition in ibrutinib-resistant GCB lymphoma cells. (A) Schematic representation BCR signaling. Ibrutinib and idelalisib block 2 effectors downstream of the BCR. (B) Percentage of viable cells in the indicated GCB lymphoma cell lines, treated with DMSO, ibrutinib, and idelalisib as single agents or in combination, at the indicated concentrations, for 72 hours. Each cell line was analyzed in triplicate, and data are shown as a bar graph corresponding to the mean ± SD. (C) Induction of apoptosis in SU-DHL-10 cell lines treated with ibrutinib and idelalisib as single agents or in combination at the indicated concentrations. Data are shown as a bar graph corresponding to the mean ± SD of 3 replicates. P values were calculated using 2-tailed Student t test. Significant changes between DMSO-treated and ibrutinib- and/or idelalisib-treated cells were labeled with **P ≤ .01; ****P ≤ .0001. (D) Phosphoflow cytometry analysis and quantification of pBTK (Tyr223), pCD19 (Tyr 531), and pGSK3β (Ser 9) in stimulated SU-DHL-10 cells pretreated with DMSO or ibrutinib (0.5 μM) and/or idelalisib (1 μM) for 6 hours. Data are represented as bar plots corresponding to the mean ± SD of 3 replicates, normalized to the stained, unstimulated controls. Significant changes between stimulated cells (orange bars) and stimulated cells treated with ibrutinib (blue bars), idelalisib (light blue bars), or a combination of the 2 (red bars) are labeled with *P ≤ .05; **P ≤ .01; ***P ≤ .001. Unlabeled bars indicate not statistically significant changes. (E) Western blot analysis of the indicated cell lines treated with DMSO or ibrutinib (0.5 μM) and/or idelalisib (1 μM) for 24 hours. Signal quantification was performed using Image Studio Lite and normalized to the DMSO-treated control. CTR, control; IBR, ibrutinib; ID, idelalisib.
Figure 5.
Figure 5.
Genetic and pharmacological inhibition of SRC-family kinases block multiple oncogenic signals downstream BCR. (A) BCR signaling representation. The SRC family kinases LYN, FYN, and BLK transmit the signal to multiple effectors including SYK-BTK, CD19, and GSK3β. (B) Quantification of cell viability in SU-DHL-2 cells with dual or triple knockout of LYN, FYN, and BLK, based on the percentage of fluorescent cells (GFP, RFP, tagRFP657). Dual LYN-FYN (RFP, GFP-positive) cells were used as control. (C) Percentage of cells sensitive to the indicated SRC inhibitors based on COSMIC dataset. (D) Scatter plot representing the IC50s (the dotted line indicates the 50% inhibitory concentration (IC50) threshold = 20 μM) for masitinib treatment in 923 cells lines (gray). The colored points represent the DLBCL cell lines. In green are the cell lines sensitive to masitinib (24 cell lines) with IC50 lower than the threshold, and in red are the cell lines resistant to masitinib (5 cell lines), with IC50 higher than the threshold. (E) Percentage of viable cells in the indicated ABC and GCB lymphoma cell lines, treated with DMSO or with masitinib at 2.5, 5, or 10 μM for 72 hours. Each cell line was analyzed in triplicate, and data are shown as a graph corresponding to the mean ± SD. (F) Scatter plot showing the expression of masitinib target genes (fpkm, fragments per kilobase million) vs their reported dissociation constant (Kd) for masitinib. (G,I,K) Quantification of fluorescence signals (MFIs) of BTK (G), CD19 (I), and GSK3β (K) phosphorylation assessed by phosphoflow cytometry for patients with DLBCL treated with DMSO or ibrutinib (0.5 μM) or masitinib (5 μM) for 6 hours and stimulated with H2O2 for 3 minutes. The bar plots correspond to the mean of normalized MFI ± SD of 3 replicates, and data were normalized on stained, unstimulated cells. Significant changes between stimulated cells (orange bars) and stimulated cells treated with ibrutinib (blue bars) or masitinib (green bars) are labeled with an asterisk (uncorrected P ≤ .05). Unlabeled bars indicate not statistically significant changes. (H,J,L) Quantification of BTK (H), CD19 (J), and GSK3β (L) phosphorylation fluorescence signals assessed by phospho-flow cytometry for indicated cell lines treated with DMSO or ibrutinib (0.5 μM) or masitinib (5 μM) for 6 hours and stimulated with H2O2 for 3 minutes. The bar plots correspond to the mean of normalized MFI ± SD of 3 replicates, normalized on stained, unstimulated controls. Significant changes between stimulated cells (orange bars) and stimulated cells treated with ibrutinib (blue bars) or masitinib (green bars) are labeled with an asterisk (P ≤ .05). Unlabeled bars indicate not statistically significant changes. (M) MYC expression in the indicated ibrutinib-resistant cell lines treated with DMSO or masitinib (5 μM) for 24 or 48 hours. Each cell line was analyzed in 3 biological replicates, and data are shown as a bar graph corresponding to the mean ± SD. P values were calculated using 2-tailed Student t test. Significant changes between DMSO-treated and masitinib-treated cells are labeled with **P ≤ .01; ****P ≤ .0001. (N) Western blot analysis of MYC in SU-DHL-2 cells ibrutinib-resistant treated with DMSO or masitinib (5 μM) for 24 or 48 hours.
Figure 6.
Figure 6.
Patient-derived cells engrafted in NSG mice are sensitive to masitinib. (A) Pipeline for xenograft studies. WSU-DLCL2 cells were injected subcutaneously; mice were treated with vehicle or masitinib (50 mg/kg per day IP) for 12 days, and tumor growth was assessed by luminescence. (B) Representative images of bioluminescence signals from xenografted mice after 12 days of treatment with vehicle or masitinib. (C) Average of the tumor weight harvest from animals treated with masitinib (n = 6) or vehicle (n = 6). The P value was calculated using 2-tailed Student t test. (D) Representative images of immunohistochemistry analyses of tumors harvested from xenografted animals and stained for Ki67 and MYC. Scale bars, 100 μm. (E) Representation of the experiment design to assess the effect of masitinib and ibrutinib in a DH patient-derived xenograft model (patient 69487). Primary tumor cells were obtained from a de novo diagnosed DH lymphoma patient, engineered to express luciferase and injected in NSG mice. Six days after injection, animals were treated with vehicle, masitinib (50 mg/kg per day IP), or ibrutinib (12 mg/kg per day IP), and tumor growth was assessed by luminescence. (F) Images of bioluminescent signals in animals treated with masitinib, ibrutinib, or vehicle at days 6, 10, 14, 18, and 22. (G) Quantification of the bioluminescence signals in animals treated with masitinib, ibrutinib, or vehicle at days 6, 10, 14, 18, and 22. The signal (photons/sec) was normalized to the first day of treatment (day 6). Tumor growth is represented as the mean ± SEM of the luminescence signal for the indicated number of animals. P value was calculated using 2-tailed Student t test. Significant changes between untreated and ibrutinib or masitinib-treated mice at the different points are labeled with *P ≤ .05; **P ≤ .01; ****P ≤ .0001. (H) Representation of the experimental design to assess the effect of masitinib and ibrutinib in ABC-DLBCL patient-derived xenograft (patient 13796). (I) Representative images by ultrasound of the abdomens and liver autopsy of animals harboring ABC lymphoma and treated vehicle, ibrutinib, and masitinib for 2 months. The dotted lines were designed to highlight the tumor. (J) MYC expression in blood samples isolated from animals untreated or treated with ibrutinib or masitinib (n = 5 per group). P values were calculated using 2-tailed Student t test. Significant changes between untreated and ibrutinib or masitinib-treated mice are labeled with *P ≤ .05. (K) Survival analysis of animals bearing ABC-lymphoma (patient 13796) untreated or treated with ibrutinib (12 mg/kg per day IP) or masitinib (50 mg/kg per day IP).

Comment in

Similar articles

Cited by

References

    1. Alizadeh AA, Eisen MB, Davis RE, et al. Distinct types of diffuse large B-cell lymphoma identified by gene expression profiling. Nature. 2000;403(6769):503-511. - PubMed
    1. Rosenwald A, Wright G, Chan WC, et al. ; Lymphoma/Leukemia Molecular Profiling Project. The use of molecular profiling to predict survival after chemotherapy for diffuse large-B-cell lymphoma. N Engl J Med. 2002;346(25):1937-1947. - PubMed
    1. Wright G, Tan B, Rosenwald A, Hurt EH, Wiestner A, Staudt LM. A gene expression-based method to diagnose clinically distinct subgroups of diffuse large B cell lymphoma. Proc Natl Acad Sci USA. 2003;100(17):9991-9996. - PMC - PubMed
    1. Pasqualucci L, Trifonov V, Fabbri G, et al. Analysis of the coding genome of diffuse large B-cell lymphoma. Nat Genet. 2011;43(9):830-837. - PMC - PubMed
    1. Zhang J, Grubor V, Love CL, et al. Genetic heterogeneity of diffuse large B-cell lymphoma. Proc Natl Acad Sci USA. 2013;110(4):1398-1403. - PMC - PubMed

Publication types

MeSH terms