. 2015 Oct 10;3(4):111-122.
doi: 10.3390/dj3040111.

Mineralization of Early Stage Carious Lesions In Vitro-A Quantitative Approach

Affiliations

Mineralization of Early Stage Carious Lesions In Vitro-A Quantitative Approach

Hans Deyhle et al. Dent J (Basel). .

Abstract

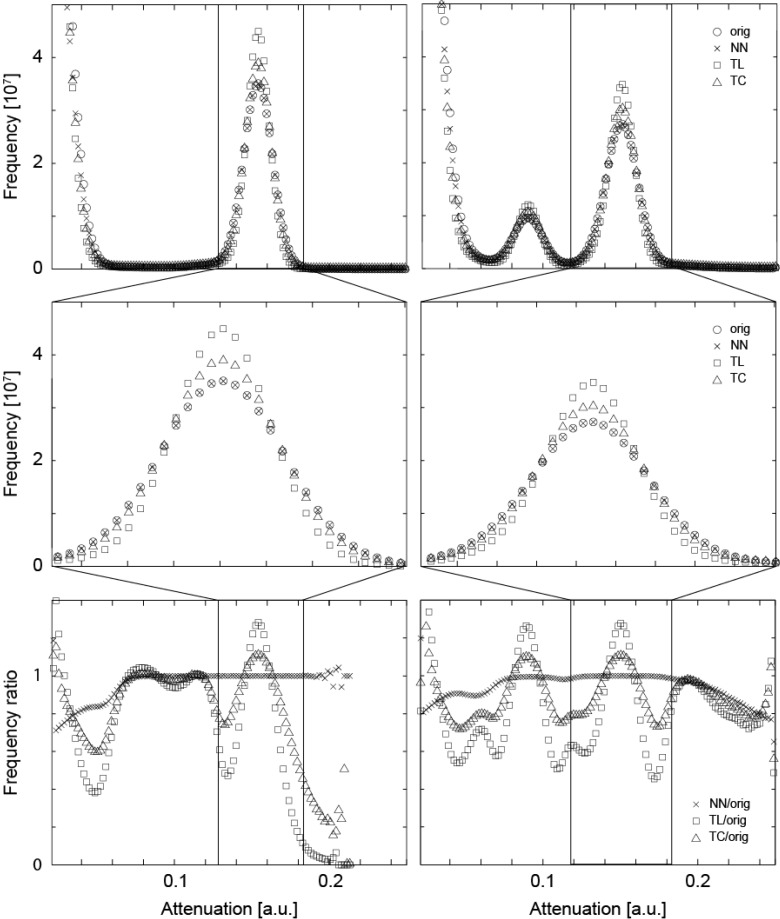
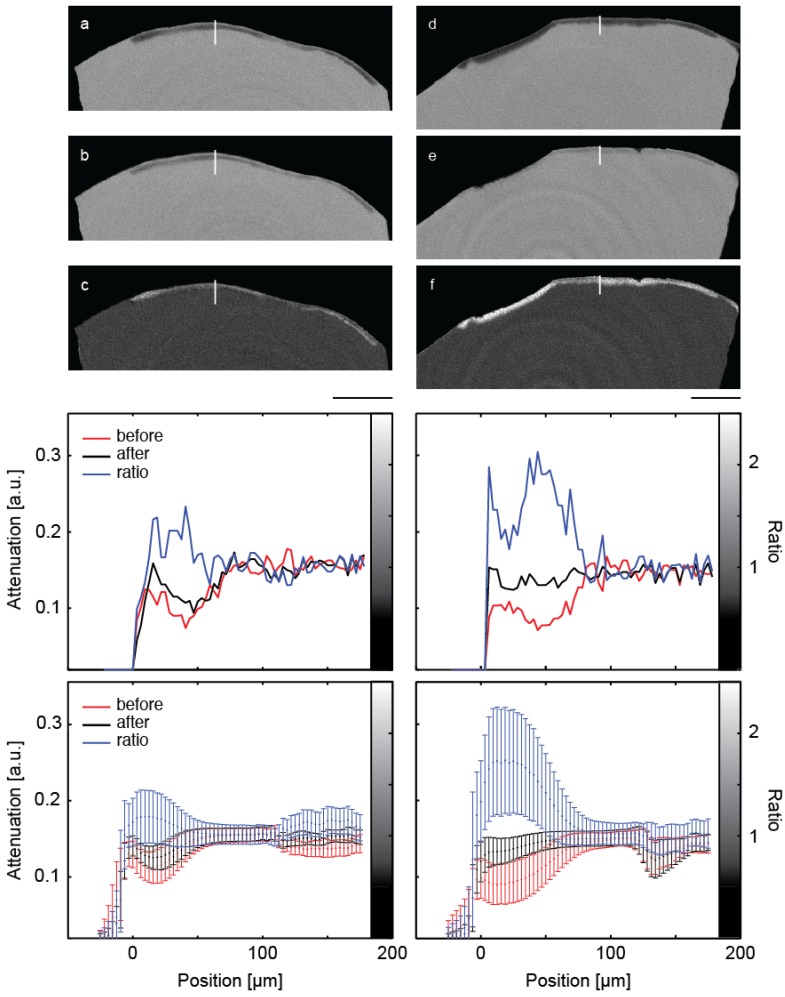
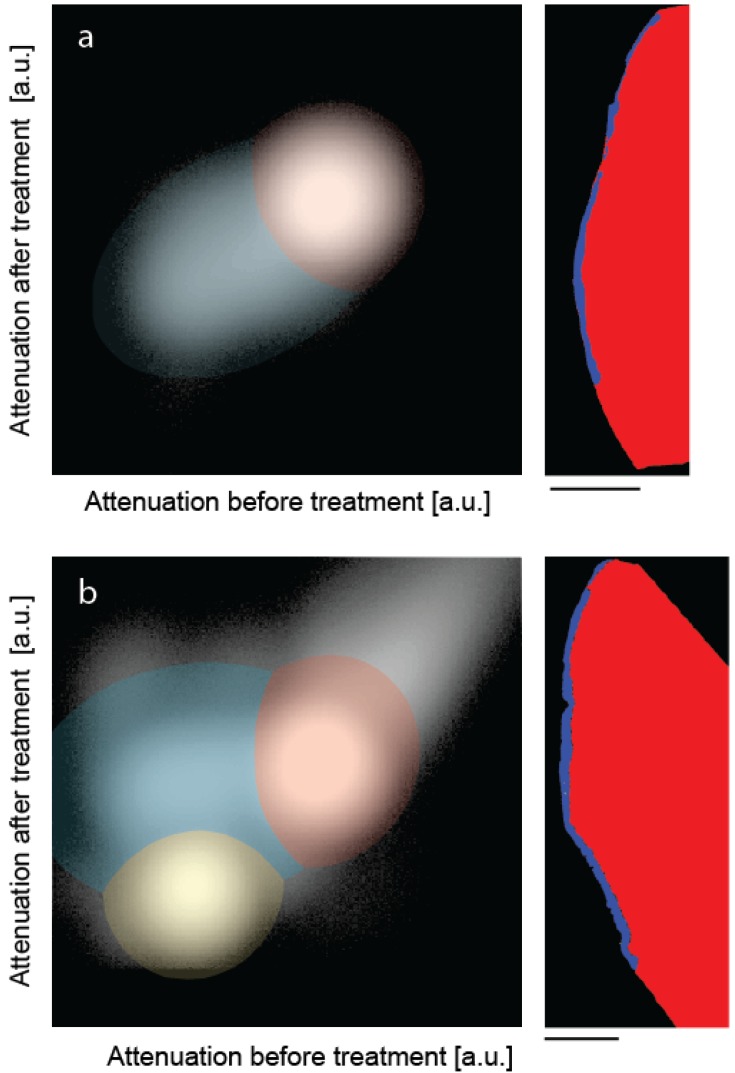
Micro computed tomography has been combined with dedicated data analysis for the in vitro quantification of sub-surface enamel lesion mineralization. Two artificial white spot lesions, generated on a human molar crown in vitro, were examined. One lesion was treated with a self-assembling peptide intended to trigger nucleation of hydroxyapatite crystals. We non-destructively determined the local X-ray attenuation within the specimens before and after treatment. The three-dimensional data was rigidly registered. Three interpolation methods, i.e., nearest neighbor, tri-linear, and tri-cubic interpolation were evaluated. The mineralization of the affected regions was quantified via joint histogram analysis, i.e., a voxel-by-voxel comparison of the tomography data before and after mineralization. After ten days incubation, the mean mineralization coefficient reached 35.5% for the peptide-treated specimen compared to 11.5% for the control. This pilot study does not give any evidence for the efficacy of peptide treatment nor allows estimating the necessary number of specimens to achieve significance, but shows a sound methodological approach on the basis of the joint histogram analysis.

Keywords: demineralization; enamel caries; image registration; joint histogram; micro computed tomography; mineralization; self-assembling peptide.


Conflict of interest statement

The authors declare no conflict of interest.

Figures

Figure 1
Figure 1
The attenuation histograms of the registered μCT datasets differ from the one of the original data. For the original data and the three interpolation methods, i.e., nearest neighbor (NN), the tri-linear (TL), and the tri-cubic (TC), the histograms of the entire volumes (top) and histograms related to enamel (middle) are displayed. For the plots in the bottom row, the point-wise ratio between the histograms of the interpolated and original data was represented. For the two crown pieces (left and right column, respectively) the NN interpolation does much less influence the histogram than the TL and TC interpolation procedures. Thus, the NN algorithm is selected for the joint histogram analysis, see below.
Figure 2
Figure 2
The images show selected slices of the μCT-data from the two pieces of the crown through the induced lesions. The images (a) and (d) are obtained before treatment. The related slices of the μCT-data after the treatment are images (b) and (e), (b) being the control and (e) the specimen treated with the peptide. Images (c) and (f) show the ratio of the attenuation values. The length bar corresponds to 500 μm. The diagrams in the central row show selected line plots through the lesion with locations indicated by the white lines in the images above. The increased mineral content caused by the mineralization treatments is clearly indicated. In the diagrams in the bottom row, the attenuation in the lesions is plotted against the distance from the specimen surface, integrated over the entire specimen. Error bars correspond to the standard deviation.
Figure 3
Figure 3
The joint histograms of the three-dimensional datasets allow segmenting the artificial lesions: (a) incubation of bare lesion and (b) incubation after peptide treatment. The selected virtual cuts through the sound enamel (red color) and the affected enamel (blue color) demonstrate the possibility of reliably segmenting the enamel lesion. The bar corresponds to the length of 500 μm.

Similar articles

Cited by

References

    1. Featherstone J.D. Dental caries: A dynamic process. Aust. Dent. J. 2008;53:286–291. doi: 10.1111/j.1834-7819.2008.00064.x. - DOI - PubMed
    1. Shore R.C., Kirkham J., Brookes S.J., Wood S.R., Robinson C. Distribution of exogenous proteins in caries lesions in relation to the pattern of demineralisation. Caries Res. 2000;34:188–193. doi: 10.1159/000016588. - DOI - PubMed
    1. Wefel J.S. Root caries histopathology and chemistry. Am. J. Dent. 1994;7:261–265. - PubMed
    1. de Marsillac M.W., de Sousa Vieira R. Assesment of artificial caries lesions through scanning electron microscopy and cross-sectional microhardness test. Indinan J. Dent. Res. 2013;24:249–254. doi: 10.4103/0970-9290.116699. - DOI - PubMed
    1. Wood S.R., Kirkham J., Marsh P.D., Shore R.C., Naltress B., Robinson C. Architecture of intact natural human plaque biofilms studied by confocal laser scanning microscopy. J. Dental Res. 2000;79:21–27. doi: 10.1177/00220345000790010201. - DOI - PubMed

LinkOut - more resources