. 2018 May;28(5):518-528.
doi: 10.1038/s41422-018-0029-3. Epub 2018 Mar 22.

Cryo-EM structure of human mTOR complex 2

Affiliations

Cryo-EM structure of human mTOR complex 2

Xizi Chen et al. Cell Res. 2018 May.

Abstract

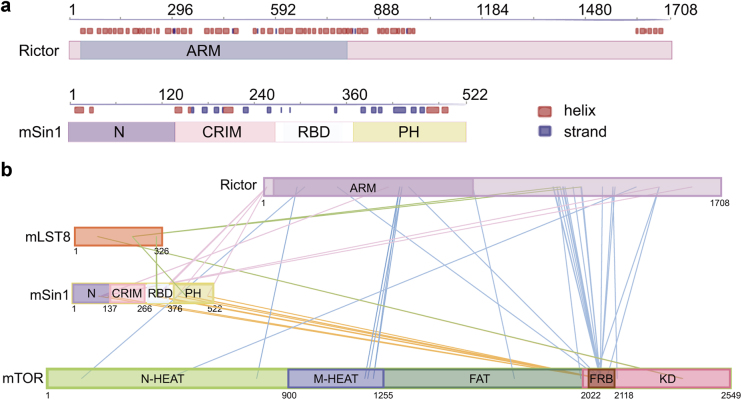
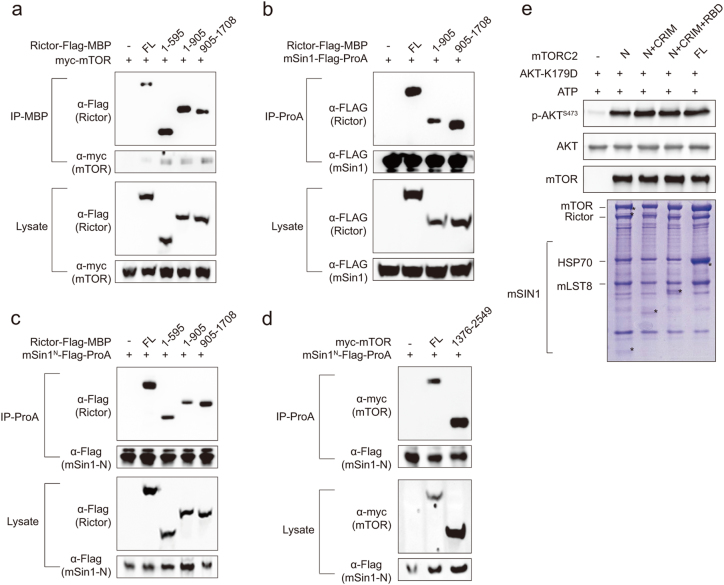
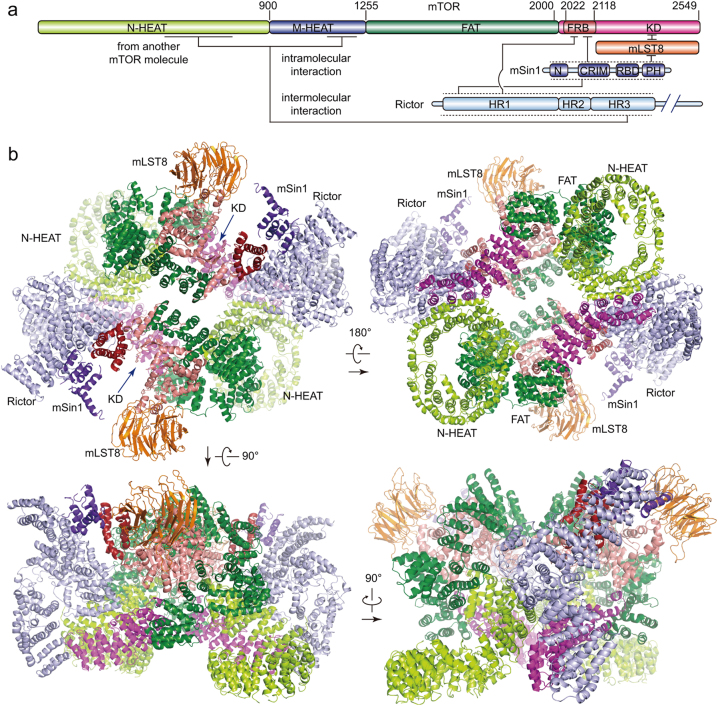
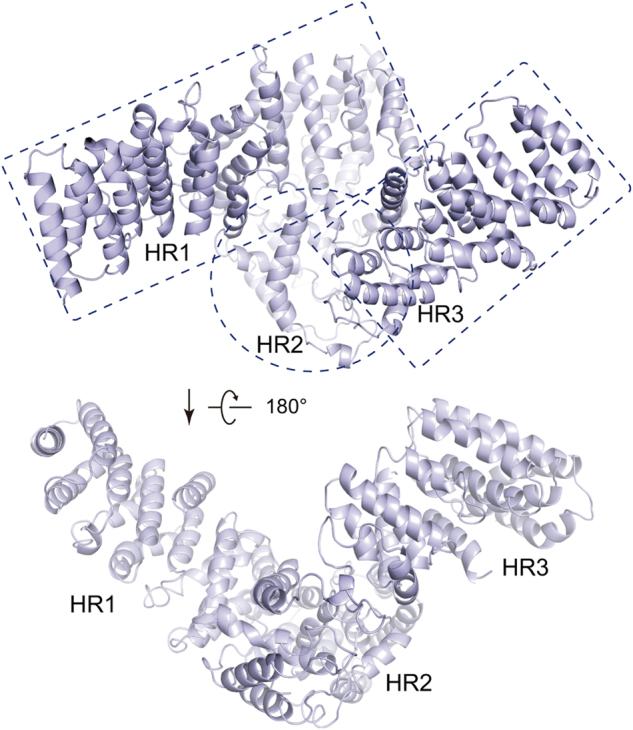
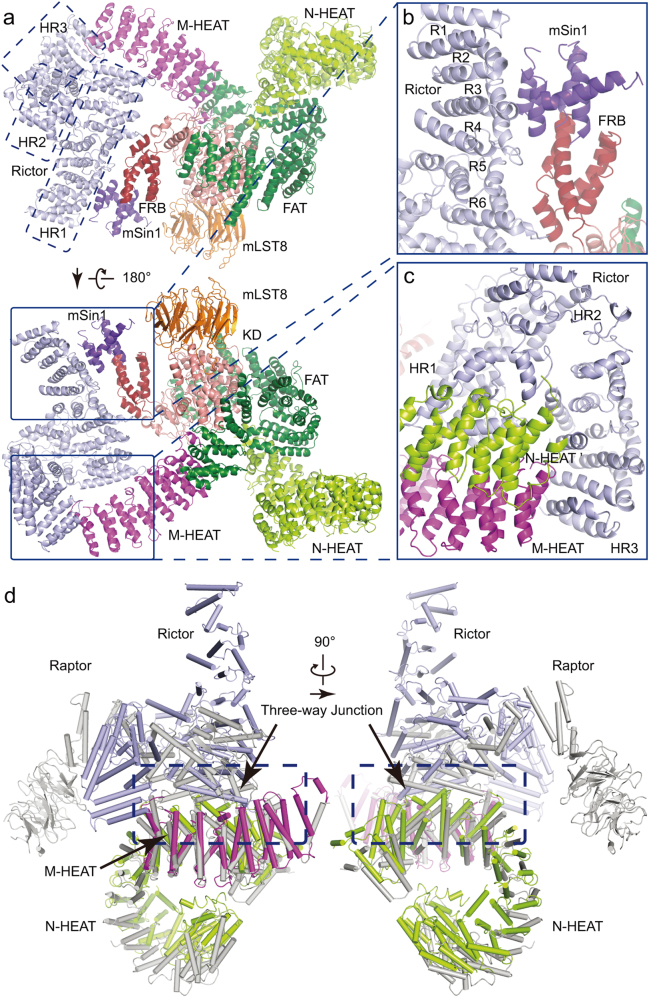
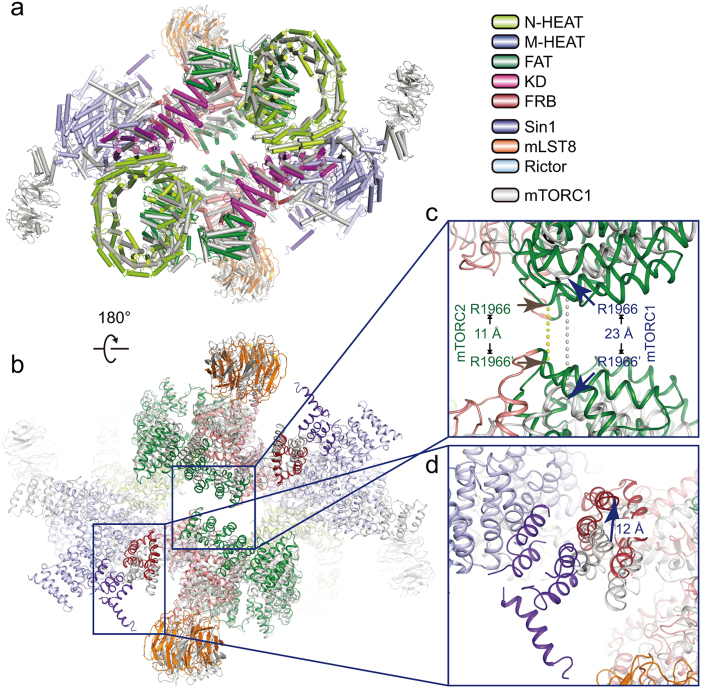
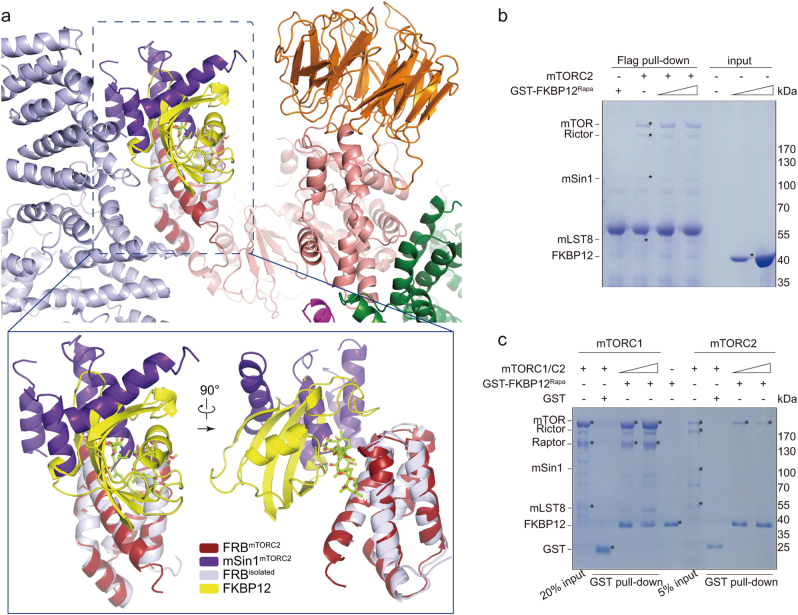
Mechanistic target of rapamycin (mTOR) complex 2 (mTORC2) plays an essential role in regulating cell proliferation through phosphorylating AGC protein kinase family members, including AKT, PKC and SGK1. The functional core complex consists of mTOR, mLST8, and two mTORC2-specific components, Rictor and mSin1. Here we investigated the intermolecular interactions within mTORC2 complex and determined its cryo-electron microscopy structure at 4.9 Å resolution. The structure reveals a hollow rhombohedral fold with a 2-fold symmetry. The dimerized mTOR serves as a scaffold for the complex assembly. The N-terminal half of Rictor is composed of helical repeat clusters and binds to mTOR through multiple contacts. mSin1 is located close to the FRB domain and catalytic cavity of mTOR. Rictor and mSin1 together generate steric hindrance to inhibit binding of FKBP12-rapamycin to mTOR, revealing the mechanism for rapamycin insensitivity of mTORC2. The mTOR dimer in mTORC2 shows more compact conformation than that of mTORC1 (rapamycin sensitive), which might result from the interaction between mTOR and Rictor-mSin1. Structural comparison shows that binding of Rictor and Raptor (mTORC1-specific component) to mTOR is mutually exclusive. Our study provides a basis for understanding the assembly of mTORC2 and a framework to further characterize the regulatory mechanism of mTORC2 pathway.


Conflict of interest statement

The authors declare no competing interests.

Figures

Fig. 1
Fig. 1
Cross-linking mass spectrometry (XL-MS) analysis of mTORC2 complex. a Secondary structure prediction of Rictor and mSin1, the two mTORC2-specific components. Predicted helices and strands are indicated by red and blue squares, respectively. The N-terminal portion of Rictor is predicted to be armadillo (ARM) repeat clusters. b Schematic representation of the intermolecular cross-links within mTORC2 complex. The identified intermolecular cross-links are indicated by color-coded solid lines. The intramolecular cross-links were omitted for simplicity. N-HEAT, N-terminal HEAT repeats; M-HEAT, middle HEAT repeats; FAT, FRAP, ATM, TRRAP domain; KD, kinase domain; FRB, FKBP12-rapamycin binding; N, N-terminal region of mSin1; CRIM, conserved region in the middle; RBD, Ras binding domain; PH, pleckstrin homology
Fig. 2
Fig. 2
Intermolecular interactions within mTORC2 complex. a Co-immunoprecipitations of full-length mTOR and various Rictor truncations. Various Rictor truncations and myc-tagged mTOR were co-transfected into 293F cells and Rictor proteins (containing C-terminal Flag and MBP tags) were immobilized using Amylose resins. The bound proteins and whole cell lysates were subjected to SDS-PAGE and visualized by western blotting using antibodies as indicated. b, c Co-immunoprecipitations of various Rictor truncations and full-length mSin1 (b) or mSin1N (c). d Co-immunoprecipitations of mSin1N with full-length and truncated mTOR. The experiments were performed as described in a. e In vitro kinase assay using purified mTORC2 containing full-length or truncated mSin1. Purified human AKT (K179D, kinase-dead mutant) serves as a substrate. The activities of mTORC2 were detected by immunoblotting with antibodies targeting phospho-Ser473 of AKT
Fig. 3
Fig. 3
Overall structure of human mTORC2 complex. a Color-coded domain architecture of the four human mTORC2 components, mTOR, Rictor, mSin1 and mLST8. The same color scheme is used hereafter in all structure figures if not otherwise specified. The inter- and intramolecular contacts are shown as connected solid lines. The dashed lines represent unassigned regions of Rictor and mSin1 that are involved in intermolecular contacts. b Ribbon representations of the mTORC2 complex in four different views with domains indicated
Fig. 4
Fig. 4
Structure of Rictor in the mTORC2 complex. Ribbon representations of Rictor in two different views. Three helical ARM/HEAT repeat clusters, HR1 to HR3, are indicated in the dashed squares or circle
Fig. 5
Fig. 5
Intermolecular interactions within mTORC2 complex. a Ribbon representations of mTORC2 protomer in two different views. b, c Close-up views of intermolecular interactions within mTORC2. Ribbon representations are shown in two different views to better illustrate the intermolecular contacts. The three major contacts include one between Rictor and mSin1 and FRB of mTOR (b), and two between Rictor and mTOR (c). R1-R6 represent the AMR/HEAT helical repeats of Rictor HR1 subdomain. N-HEAT’ in c indicates that it is from the other mTOR molecule. The flanking HEAT repeats of this N-HEAT’ were not shown for simplicity. d Rictor and Raptor bind to the M-HEAT and N-HEAT’ of mTOR and form a three-way junction in mTORC2 and mTORC1, respectively. Superimposition of the mTORC1 (PDB: 5H64) and mTORC2 structures shown in two different views with unnecessary regions omitted. Note that two mTOR molecules are well aligned, whereas Rictor and Raptor adopt distinct conformations. The α-helices are shown as cylinders for simplicity
Fig. 6
Fig. 6
Structural comparison of mTORC1 and mTORC2. a, b Superimposition of the mTORC1 (PDB: 5H64) and mTORC2 structures shown in two different views. The helices are shown in cylinders (a) and ribbon representations (b), respectively. The color scheme is indicated. c Closed-up view of the central holes of mTORC1 and mTORC2 for comparison. The distance between residues R1966 and R1966′ (from the other mTOR molecule) is indicated for the two complexes. d Closed-up view of the FRB domains of mTORC1 and mTORC2 for comparison. The FRB domain would move upward by as far as 12 Å upon conformational transition from mTORC1 to mTORC2
Fig. 7
Fig. 7
Mechanism for rapamycin insensitivity of mTORC2. a Superimposition of the mTORC2 and FKBP12-rapamycin-FRB structures shown in ribbon representations (upper panel). Closed-up views of the superimposed structure shown in two different views (lower panel). FKBP12-rapamycin is colored in yellow and rapamycin is shown in stick representation. b, c Flag (b) or GST (c) pull-down assays were performed using purified mTORC2, mTORC1, and GST-tagged FKBP12 in the presence of rapamycin. The protein complexes were incubated and immobilized to the indicated resins, and the bound proteins were subjected to SDS-PAGE and stained using Coomassie blue

Similar articles

Cited by

References

    1. Heitman J, Movva NR, Hall MN. Targets for cell cycle arrest by the immunosuppressant rapamycin in yeast. Science. 1991;253:905–909. doi: 10.1126/science.1715094. - DOI - PubMed
    1. Sabatini DM, Erdjument-Bromage H, Lui M, Tempst P, Snyder SH. RAFT1: a mammalian protein that binds to FKBP12 in a rapamycin-dependent fashion and is homologous to yeast TORs. Cell. 1994;78:35–43. doi: 10.1016/0092-8674(94)90570-3. - DOI - PubMed
    1. Loewith R, et al. Two TOR complexes, only one of which is rapamycin sensitive, have distinct roles in cell growth control. Mol. Cell. 2002;10:457–468. doi: 10.1016/S1097-2765(02)00636-6. - DOI - PubMed
    1. Wedaman KP, et al. Tor kinases are in distinct membrane-associated protein complexes in Saccharomyces cerevisiae. Mol. Biol. Cell. 2003;14:1204–1220. doi: 10.1091/mbc.e02-09-0609. - DOI - PMC - PubMed
    1. Saxton RA, Sabatini DM. mTOR signaling in growth, metabolism, and disease. Cell. 2017;168:960–976. doi: 10.1016/j.cell.2017.02.004. - DOI - PMC - PubMed

MeSH terms

Substances