. 2018 Mar 22;9(1):1187.
doi: 10.1038/s41467-018-03608-y.

BEARscc determines robustness of single-cell clusters using simulated technical replicates

Affiliations

BEARscc determines robustness of single-cell clusters using simulated technical replicates

D T Severson et al. Nat Commun. .

Abstract

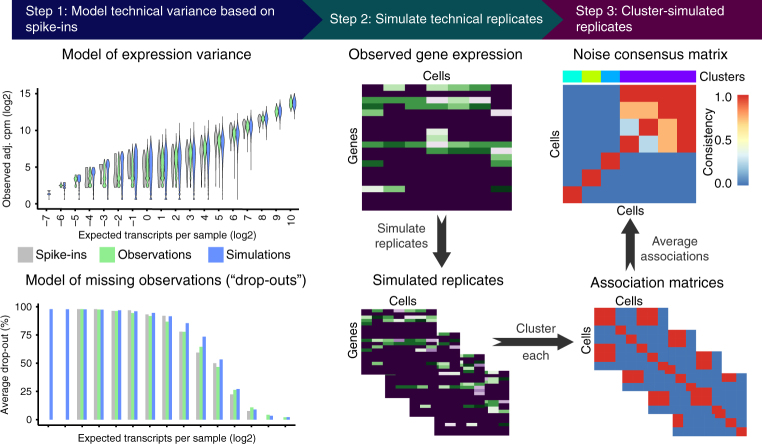
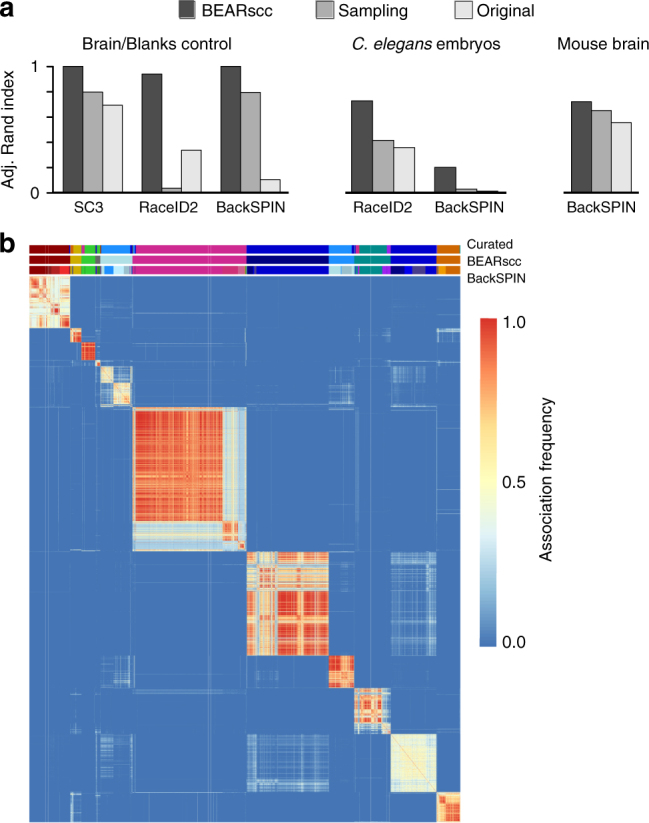
Single-cell messenger RNA sequencing (scRNA-seq) has emerged as a powerful tool to study cellular heterogeneity within complex tissues. Subpopulations of cells with common gene expression profiles can be identified by applying unsupervised clustering algorithms. However, technical variance is a major confounding factor in scRNA-seq, not least because it is not possible to replicate measurements on the same cell. Here, we present BEARscc, a tool that uses RNA spike-in controls to simulate experiment-specific technical replicates. BEARscc works with a wide range of existing clustering algorithms to assess the robustness of clusters to technical variation. We demonstrate that the tool improves the unsupervised classification of cells and facilitates the biological interpretation of single-cell RNA-seq experiments.


Conflict of interest statement

The authors declare no competing interests.

Figures

Fig. 1
Fig. 1
Overview of the BEARscc algorithm. Step 1, the variance of gene expression expected in a replicate experiment is estimated from the variation of spike-in measurements. Top: variation in spike-in read counts corresponds well with experimentally observed variability in biological transcripts (for details of control experiment see Methods) and read counts simulated by BEARscc. Bottom: drop-out likelihood is modelled separately, based on the drop-out rate for spike-ins of a given concentration. Shown is the average percentage drop-out rate as a function of the number of transcripts per sample, for spike-ins, simulated replicates and experimental observations in a control experiment (see Methods). Step 2, simulating technical replicates: the observed gene counts (top matrix) are transformed into multiple simulated technical replicates (bottom) by repeatedly applying the noise model derived in Step 1 to every cell in the matrix. Step 3, calculating a consensus: each simulated replicate (from Step 2) is clustered to create an association matrix. All the association matrices (bottom) are averaged into a single noise consensus matrix (top) that reflects the frequency with which cells are observed in the same cluster across all simulated replicates. Based on this matrix, noise consensus clusters can then be derived (coloured bar above matrix)
Fig. 2
Fig. 2
BEARscc improves clustering results and aids the interpretation of biological results. a Comparison of clustering accuracy of control data (left), C. elegans data (middle), and murine brain data (right). Adjusted Rand index denotes agreement with the manually annotated grouping of samples (1: perfect, 0: no overlap). ‘BEARscc’ indicates that BEARscc was used to generate simulated technical replicates that were clustered using the algorithm indicated below the graph; ‘Sampling’ indicates that a sub-sampling approach (see text) was used before clustering with each algorithm; ‘Original’ indicates that the clustering algorithm was used alone. b Example of a noise consensus matrix produced by BEARscc on data from murine brain cells (from Zeisel et al.) clustered with BackSPIN. Bars above heatmap show the manually curated clustering of cells (top), BEARscc consensus cluster (middle) and unsupervised BackSPIN clusters (bottom)

References

    1. Grün D, et al. Single-cell messenger RNA sequencing reveals rare intestinal cell types. Nature. 2015;525:251–255. doi: 10.1038/nature14966. - DOI - PubMed
    1. Wagner A, Regev A, Yosef N. Revealing the vectors of cellular identity with single-cell genomics. Nat. Biotechnol. 2016;34:1145–1160. doi: 10.1038/nbt.3711. - DOI - PMC - PubMed
    1. Tirosh I, et al. Dissecting the multicellular ecosystem of metastatic melanoma by single-cell RNA-seq. Science. 2016;352:189–196. doi: 10.1126/science.aad0501. - DOI - PMC - PubMed
    1. Grün D, Kester L, van Oudenaarden A. Validation of noise models for single-cell transcriptomics. Nat. Methods. 2014;11:637–640. doi: 10.1038/nmeth.2930. - DOI - PubMed
    1. Kim JK, Kolodziejczyk AA, Illicic T, Teichmann SA, Marioni JC. Characterizing noise structure in single-cell RNA-seq distinguishes genuine from technical stochastic allelic expression. Nat. Commun. 2015;6:8687–8688. doi: 10.1038/ncomms9687. - DOI - PMC - PubMed

Publication types