. 2018 Mar 22;8(1):4666.
doi: 10.1038/s41598-018-22939-w.

Evidence that the Great Pacific Garbage Patch is rapidly accumulating plastic

Affiliations

Evidence that the Great Pacific Garbage Patch is rapidly accumulating plastic

L Lebreton et al. Sci Rep. .

Abstract

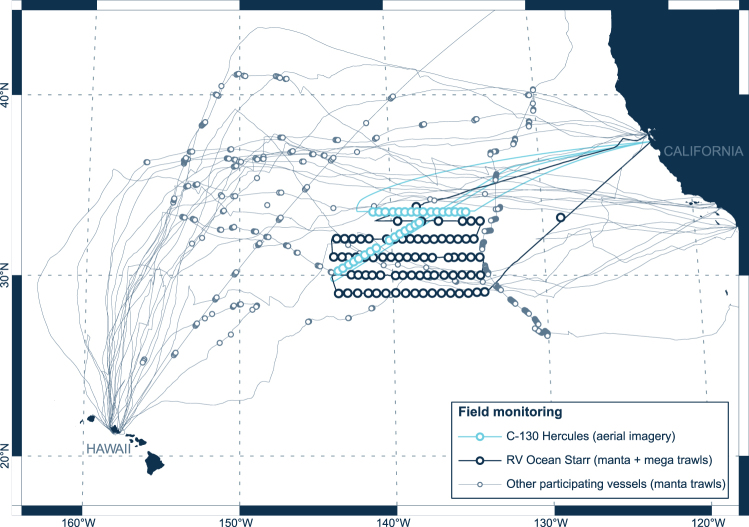
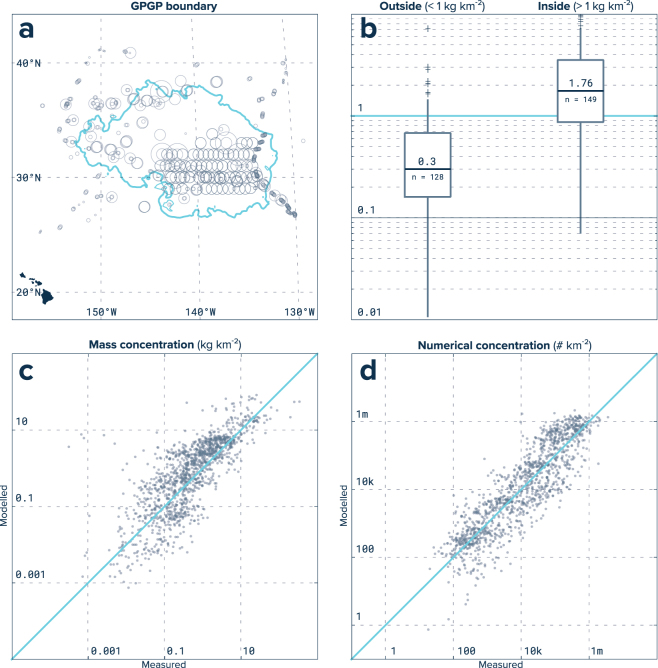
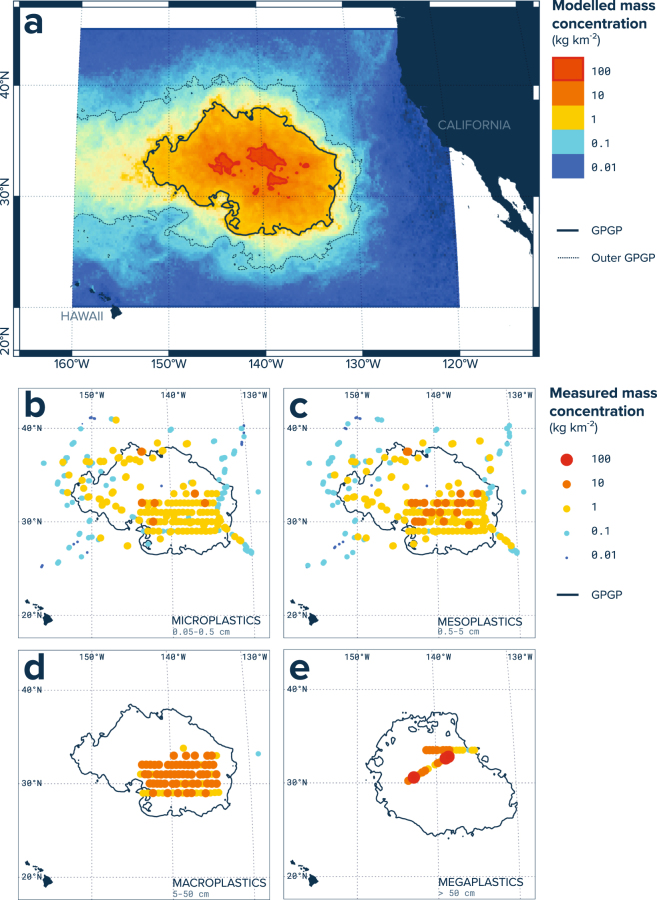
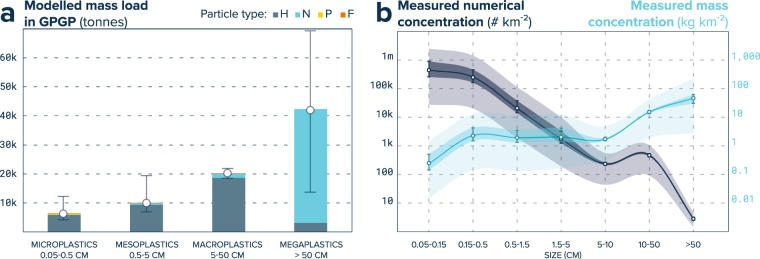
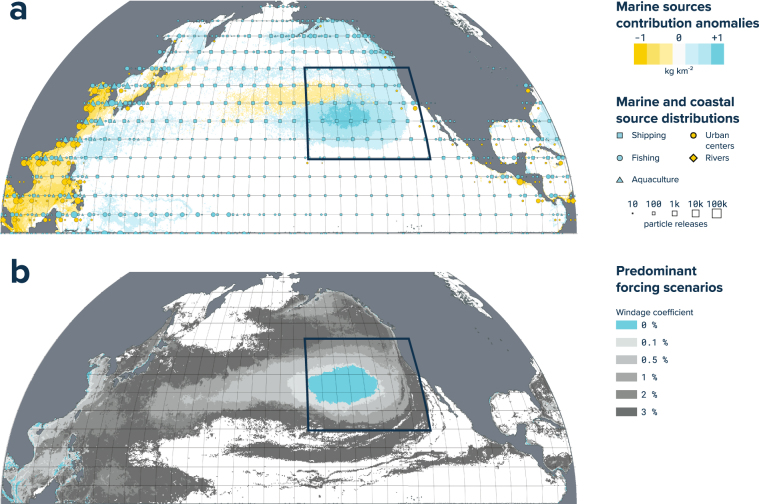
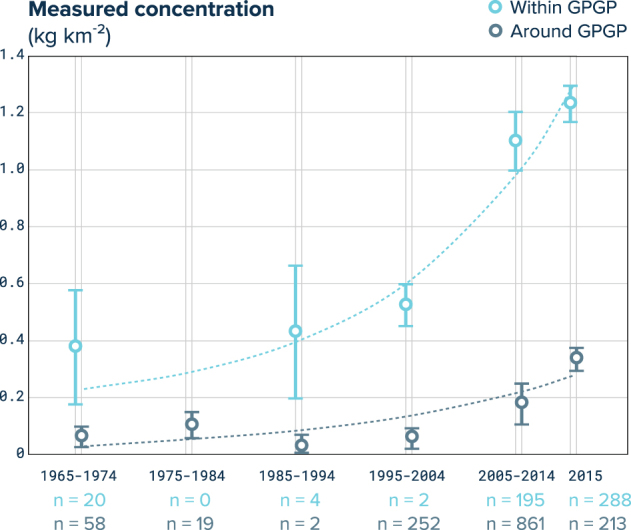
Ocean plastic can persist in sea surface waters, eventually accumulating in remote areas of the world's oceans. Here we characterise and quantify a major ocean plastic accumulation zone formed in subtropical waters between California and Hawaii: The Great Pacific Garbage Patch (GPGP). Our model, calibrated with data from multi-vessel and aircraft surveys, predicted at least 79 (45-129) thousand tonnes of ocean plastic are floating inside an area of 1.6 million km2; a figure four to sixteen times higher than previously reported. We explain this difference through the use of more robust methods to quantify larger debris. Over three-quarters of the GPGP mass was carried by debris larger than 5 cm and at least 46% was comprised of fishing nets. Microplastics accounted for 8% of the total mass but 94% of the estimated 1.8 (1.1-3.6) trillion pieces floating in the area. Plastic collected during our study has specific characteristics such as small surface-to-volume ratio, indicating that only certain types of debris have the capacity to persist and accumulate at the surface of the GPGP. Finally, our results suggest that ocean plastic pollution within the GPGP is increasing exponentially and at a faster rate than in surrounding waters.


Conflict of interest statement

The authors declare no competing interests.

Figures

Figure 1
Figure 1
Field monitoring effort. Vessel (grey and dark blue lines) and aircraft (light blue lines) tracks and locations where data on buoyant ocean plastic concentrations were collected (circles). Grey circles (n = 350) represent areas sampled with a single Manta net tow by 17 participating vessels, between July and September 2015. Dark blue circles (n = 76) represent areas sampled with paired Manta and paired Mega net tows by RV Ocean Starr, between July and August 2015. Light blue circles (n = 31) show locations of RGB geo-referenced mosaics collected from a C-130 Hercules aircraft, in October 2016. This map was created using QGIS version 2.18.1 (www.qgis.org).
Figure 2
Figure 2
Numerical model calibration. (a) The GPGP boundary (blue line) is estimated by comparing microplastic concentration measurements (circles) to model particle visit averages that accounted for seasonal and inter-annual variations. This map was created using QGIS version 2.18.1 (www.qgis.org). (b) Model validation showing median measured mass concentration for microplastics of stations outside and inside our predicted 1 kg km−2 GPGP boundary. Bars extend from 25th to 75th percentile while whiskers extend to minimum and maximum non-outlier. Outliers are represented as crosses. (c) Measured mass concentrations versus modelled mass concentrations for microplastics, mesoplastics, macroplastics and megaplastics. (d) Same as (c) but with numerical concentrations.
Figure 3
Figure 3
Modelled and measured mass concentration in the Great Pacific Garbage Patch (GPGP). (a) Ocean plastic mass concentrations for August 2015, as predicted by our data-calibrated model. The bold black line represents our established limit for the GPGP. (b) Microplastics (0.05–0.5 cm) mass concentrations as measured by Manta trawl (n = 501 net tows, 3.8 km2 surveyed). (c) Mesoplastics (0.5–5 cm) mass concentrations as measured by Manta trawl; d) Macroplastics (5–50 cm) mass concentrations as measured by Mega trawl (n = 151 net tows, 13.6 km2 surveyed); (e) Megaplastics (>50 cm) mass concentrations as estimated from aerial imagery (n = 31 mosaic segments, 311.0 km2 surveyed). All observational maps are showing mid-point mass concentration estimates as well as the predicted GPGP boundaries for the corresponding sampling period: August 2015 for net tow samples, and October 2016 for aerial mosaics. Maps were created using QGIS version 2.18.1 (www.qgis.org).
Figure 4
Figure 4
Ocean plastic size spectrum in the GPGP. (a) Plastic mass distribution within the GPGP between size (bars) and type (colours) classes. Plastic type H include pieces of hard plastic, plastic sheet and film, type N encompasses plastic lines, ropes and fishing nets, type P are pre-production plastic pellets, and type F are pieces made of foamed plastics. Whiskers extend from lower to upper estimates per size class, accounting for uncertainties in both monitoring and modelling methods. (b) Measured mass and numerical concentrations of GPGP ocean plastics. Dots represent the mean concentrations, the whiskers and darker shades represent our confidence intervals, and the lighter shades extend from the 5th and 95th percentile of measured concentrations.
Figure 5
Figure 5
Modelled source and forcing distributions. (a) North Pacific distribution of the ocean plastics sources used in this study (blue and orange squares, circles and triangles), and predicted marine source (shipping, fishing and aquaculture) anomalies in relation to the initial distribution of both marine- and land-based sources (coastal urban centres and rivers). (b) Predicted North Pacific distribution of dominant forcing scenario. Windage coefficient values correspond to the percentage contributions of wind forcing at 10 m above sea level. Maps were created using QGIS version 2.18.1 (www.qgis.org).
Figure 6
Figure 6
Decadal evolution of microplastic concentration in the GPGP. Mean (circles) and standard error (whiskers) of microplastic mass concentrations measured by surface net tows conducted in different decades, within (light blue) and around (dark grey) the GPGP. Dashed lines are exponential fits to the averages expressed in g km−2: f(x) = exp(a*x) + b, with x expressed in number of years after 1900, a = 0.06121, b = 151.3, R2 = 0.92 for within GPGP and a = 0.04903, b = −7.138, R2 = 0.78 for around the GPGP.

References

    1. Plastics Europe. Plastics - the facts 2016: an analysis of European plastics production, demand and waste data. Preprint at http://www.plasticseurope.org (2016).
    1. Geyer R, Jambeck JR, Law KL. Production, use, and fate of all plastics ever made. Sci. Adv. 2017;3:e1700782. doi: 10.1126/sciadv.1700782. - DOI - PMC - PubMed
    1. O’Hara, K., Iudicello, S. & Bierce, R. A Citizen’s Guide To Plastics In The Ocean: More Than A Litter Problem. (Center for Marine Conservation, 1988).
    1. Arthur C, Sutton-Grier AE, Murphy P, Bamford H. Out of sight but not out of mind: harmful effects of derelict traps in selected U.S. coastal waters. Mar. Pollut. Bull. 2014;86:19–28. doi: 10.1016/j.marpolbul.2014.06.050. - DOI - PubMed
    1. Al-Masroori H, Al-Oufi H, Mcllwain JL, McLean E. Catches of lost fish traps (ghost fishing) from fishing grounds near Muscat, Sultanate of Oman. Fish. Res. 2004;69:407–414. doi: 10.1016/j.fishres.2004.05.014. - DOI

Publication types